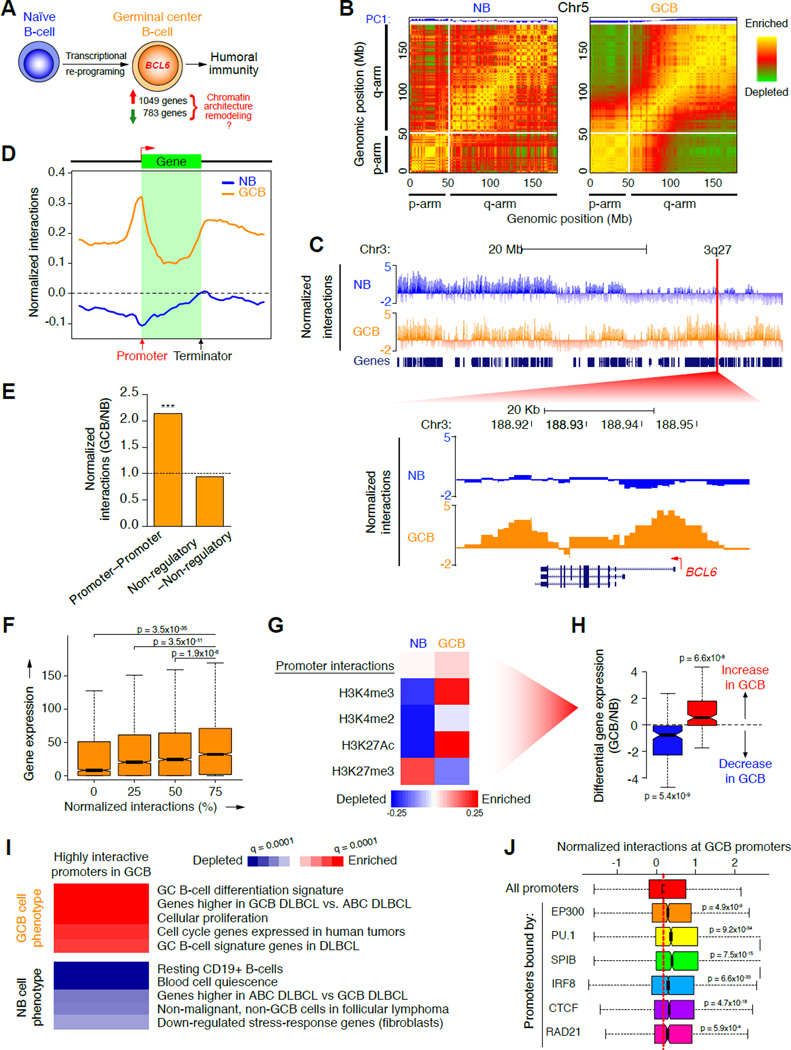
Figure 1. Topological shifts in GCB-cells involve chromosome unpacking and increased promoter interactivity.
A, Illustration of transcriptional changes during germinal center B-cell differentiation. 1,049 and 783 genes are up and down-regulated respectively, as determined by RNA-seq. B, Pearson correlation matrix plots of intra-chromosomal interactions across chromosome 5 at 1 Mb scale in NB and GCB-cells, showing PC1 and loss of interactions between the p (short) and q (long) arms of chromosomes in GCB-cells. The degree of correlation is indicated by yellow (enrichment), green (depletion) or red (no correlation). Centromere positions are indicated by the lack of DNA mappability (white). C, UCSC Genome Browser tracks showing normalized interaction frequencies, as measured by Hi-C, for naïve B and GCB-cells across a region of chromosome 3, with a zoomed in view of a 3q27 locus encoding BCL6. D, Profiles of the abundance of genome-wide interactions (normalized) across regions encoding genes (± 50 Kb) in naïve B and GCB-cells. E, Relative enrichment of promoter–promoter and non-regulatory–non-regulatory interactions, as a fraction of all interactions in GCB versus naïve B-cells. ***p<10−15, χ2 test. F, Correlation between gene expression (RPKM) and normalized interaction frequency percentiles (quartiles) in naïve B and GCB-cells. Median gene expression was compared between the 25% most interactive promoters and all other quartiles, using non-parametric Wilcoxon tests. G, Principal component analysis of promoter interactions (Hi-C) and histone modification peaks (ChIP-seq), in naïve and GCB-cells. Degree of correlation is indicated by the color key showing enrichment (red) and depletion (blue) and represents normalized read counts (for Hi-C and ChIP-seq data). Only genes in this principal component were differentially expressed as shown in: H, Differential gene expression (log2 ratio) of genes enriched (red) or depleted (blue) in the principal component promoter set shown in G. p-values were calculated using a threshold of >20% expression change between naïve B and GCB-cells. I, The heatmap represents GSEA of genes with highly interactive promoters in GCB-cells showing gene signatures that are positively or negatively enriched (FDR = 0.01). J, Correlations between normalized promoter interaction frequencies and enrichment of the listed regulatory factors as determined by ChIP-chip or ChIP-seq in GCB-cells (compared to all promoters). Significance was determined using Mann-Whitney’s test. n.s., non-significant. See also figure S1.

