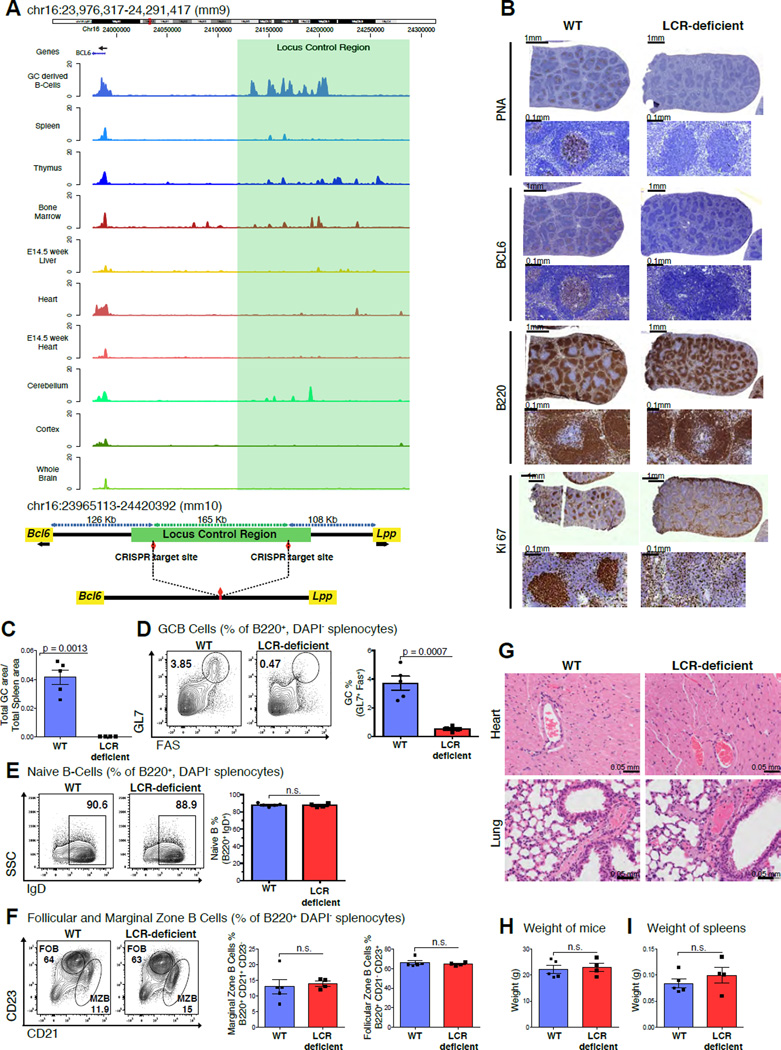
Figure 7. Disruption of the LCR leads to GC formation defects.
A, Tracks for H3K27Ac read densities (top panel) normalized to input for murine tissues including GC derived malignant B-cells and other Bcl6 expressing tissues. The region shaded in green represents the location of the syntenic LCR. Schematic illustrating the locus upstream of Bcl6 in the mouse genome before and after CRISPR-mediated deletion (bottom panel). B, Immunohistochemistry images of mouse spleens stained with antibodies against PNA, BCL6, B220 and Ki67. C, Bar plot representing the splenic area occupied by GCs based on PNA-IHC in WT vs. LCR-deficient mice. D, Representative flow cytometry plots of WT and LCR-deficient mice (left panel), quantification for GCB (GL7+FAS+) (right panel). E, F, Representative flow cytometry plots of naïve B-cells (B220+, IgD+), follicular (B220+, CD23high) and marginal zone B-cells (B220+, CD21high). G, Representative images of H&E stained Heart and Lung sections from the WT and LCR-deficient mice. H, I, Bar plots depicting average weight of the mice and spleens in the WT and LCR-deficient groups. Data in B, C, D, E, F, G, H and I are representative from one of two replicate experiments with 5 WT littermates and 4 LCR-deficient mice. The data is shown as mean ± SEM. Significance is calculated by performing a two-tailed, unpaired t-test. P-values are listed wherever the difference is significant. See also Figure S6.

