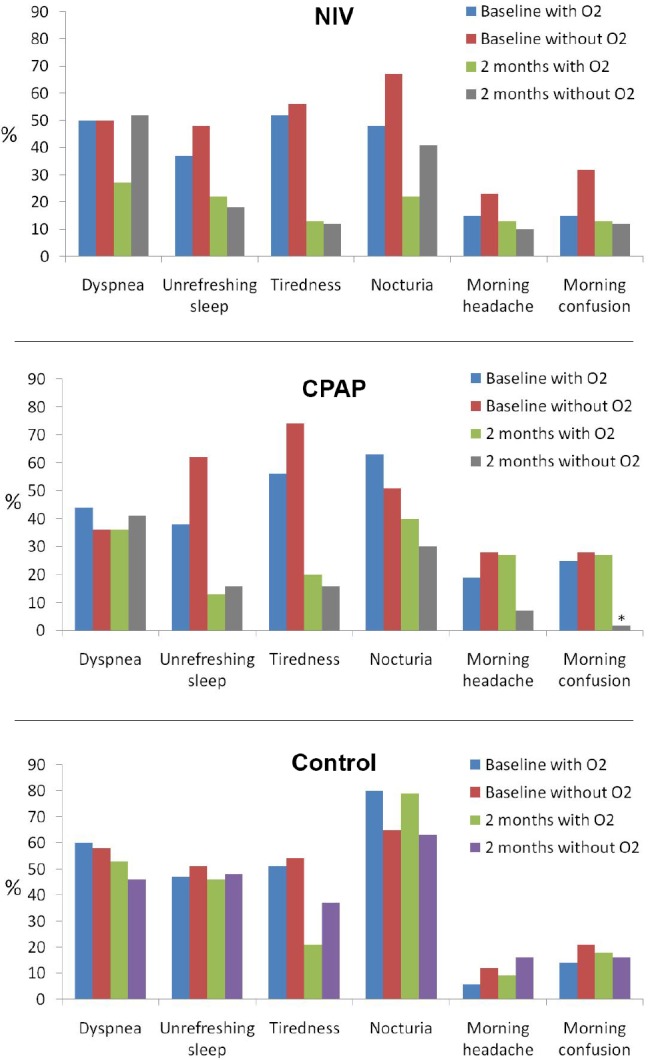
Figure 2. Frequency of clinical symptoms in the three intervention groups (NIV, CPAP, and control) distributed in baseline with and without supplemental oxygen therapy and after 2 mo with and without supplemental oxygen therapy.

Statistically we compared the percentage at the end of the follow-up between patients with and without supplementary oxygen therapy in each of interventions groups by unadjusted analysis and the following adjusted models: (1) baseline values of the variable analyzed, age, sex, body mass index (BMI), the forced expiratory volume in 1 sec, and apnea-hypopnea index (baseline adjustment); and (2) baseline adjustment, BMI change, and CPAP or NIV compliance (hour/day); in the control group the last adjustment was only performed with BMI change. *Unadjusted p < 0.01; baseline adjusted p < 0.01; and all adjusted p < 0.01. CPAP, continuous positive airway pressure; NIV, noninvasive ventilation.
