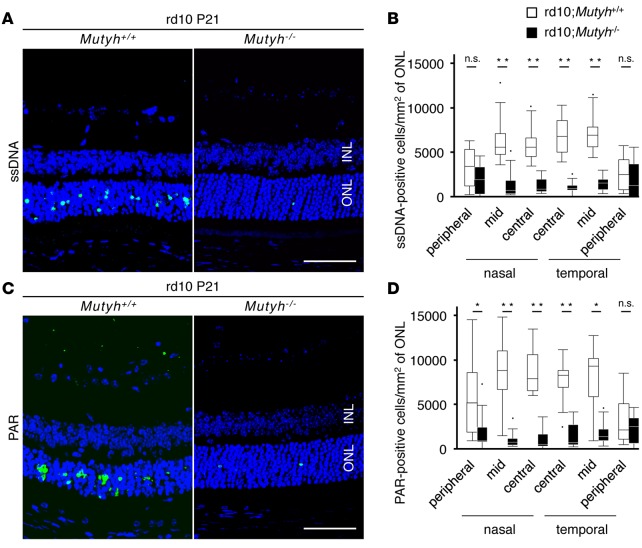
Figure 2. Mutyh deficiency suppressed the formation of SSBs and PARP activation in rd10 mice.
(A and B) ssDNA (green) and DAPI (blue) staining (A) and quantification of ssDNA-positive cells (B) in the retinas of P21 rd10;Mutyh+/+ mice (n = 8) or rd10;Mutyh−/− mice (n = 7). INL, inner nuclear layer; ONL, outer nuclear layer. Scale bar: 50 μm. (C and D) PAR (green) and DAPI (blue) staining (C) and quantification of PAR-positive cells (D) in the retinas of P21 rd10;Mutyh+/+ mice (n = 8) or rd10;Mutyh−/− mice (n = 7). Scale bar: 50 μm. Data shown are the combined results for all mice in 2–4 experiments. Data are presented as whisker-box plots. The central horizontal bars indicate the medians, boxes indicate 25th to 75th percentiles, and whiskers indicate 1.5 times the interquartile range from the bottom and the top of the box. Outliers are shown as dots. Wilcoxon rank sum tests were performed to assess the significance. *P < 0.05, **P < 0.01.

