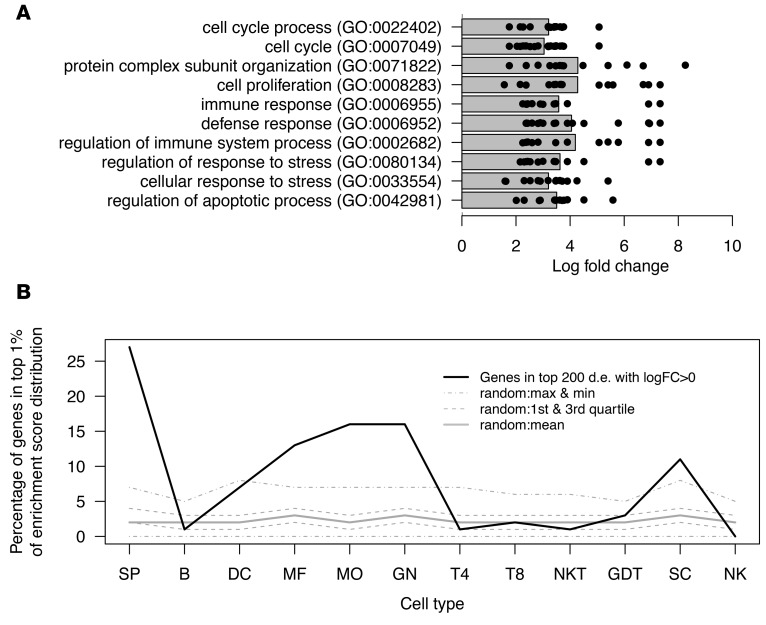
Figure 1. Catheterization induces substantial gene expression changes in the bladder.
Female C57BL/6 mice were implanted with a 5-mm silicon catheter, which naive control animals did not receive. After 24 hours, bladders were processed and RNA was recovered. Gene expression analysis was performed as described in the Methods. (A) Summary of gene ontology (GO) enrichment analysis in the top 200 most differentially expressed genes (Padj < 5 × 10-26) that showed increased mRNA levels in catheterized versus noncatheterized bladders. Each data point shows the log2 mean expression ratio between catheterized and noncatheterized animals (x axis). Genes are categorized by annotation to each enriched GO biological process term (y axis). Gray bars show the mean log fold change for genes annotated to each enriched term. See Supplemental Table 4 for further results. (B) To identify differentially expressed genes (d.e.) associated with specificity for a given cell type in the ImmGen data, we calculated the percentage of the top 200 genes that was contained in the top 1% of the distribution of the cell-type–specific enrichment score (51) (solid black line; compared with 100 sets of size- and abundance-matched random genes [summarized by gray lines]). SP, stem and progenitor cells; B, B cells; MF, macrophages; MO, monocytes; GN, granulocytes; T4, CD4+ cells; T8, CD8+ cells; GDT, γδ T cells; SC, stromal cells. See Supplemental Tables 1–5 and Supplemental Figures 1–3 for related analyses. The experiment was performed twice (n = 3 mice per group/experiment). Representative data are shown from one experiment.

