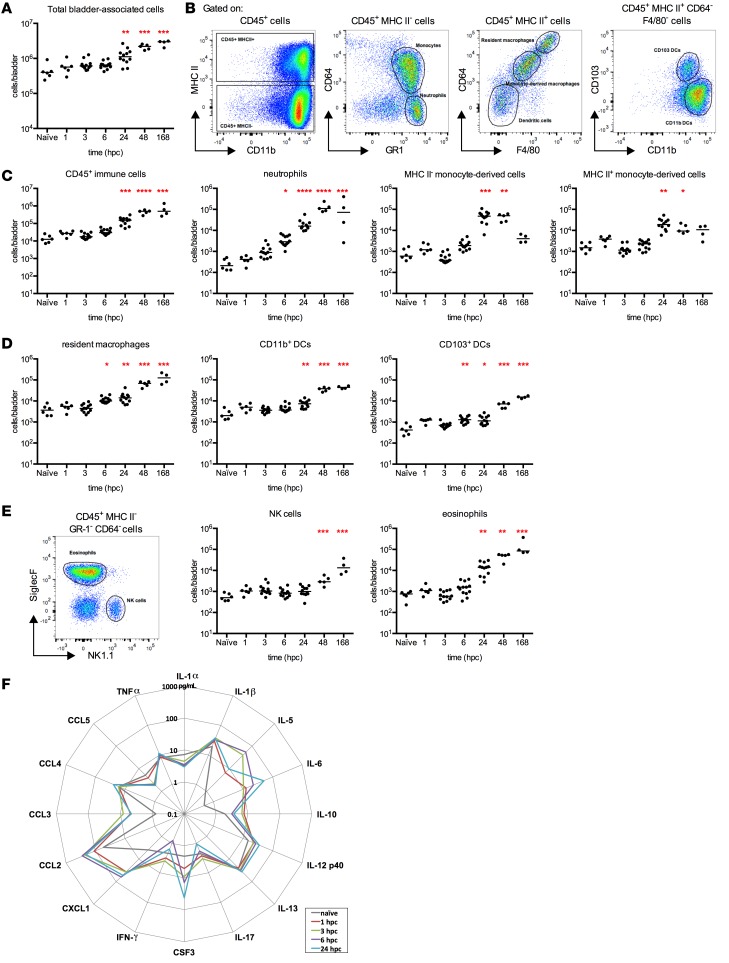
Figure 2. Innate immune cells robustly migrate into the bladder rapidly after catheterization.
Naive C57BL/6 female mice were implanted with catheters. At the indicated hour after catheterization (hpc), bladders were recovered and processed into a single-cell suspension, labeled with antibodies listed in Supplemental Table 6, and acquired on a Sony SP6800 Spectral Analyzer. (A) The total number of cells per bladder at the indicated hpc. (B) Representative dot plots from a mouse 24 or 48 hpc illustrate the gating strategy used to identify immune cell subsets graphed in C and D. (C and D) The total number of the specified cell populations per bladder at indicated hpc. (E) The dot plot (48 hpc) illustrates the gating strategy used to identify NK cells and eosinophils, and the graphs depict the total number of NK cells and eosinophils per bladder at the indicated hpc. (F) The spider plot depicts absolute values in pg/ml of the indicated cytokines at 0 (naive), 1, 3, 6, and 24 hpc. In A and C–E, each dot represents 1 mouse, and the experiment was performed 2 times (n = 6–7 mice per experimental group). In F, the experiment was performed 2 times (n = 5 mice per experimental group). In A and C–F, experiments are pooled. The presence of a catheter was verified at the time of sacrifice, and mice without a catheter were excluded from the analysis. *P < 0.05, **P < 0.01, ***P < 0.001, ****P < 0.0001 for experimental groups compared with the control naive group, Kruskal-Wallis test with Dunn’s post-test to correct for multiple comparisons.

