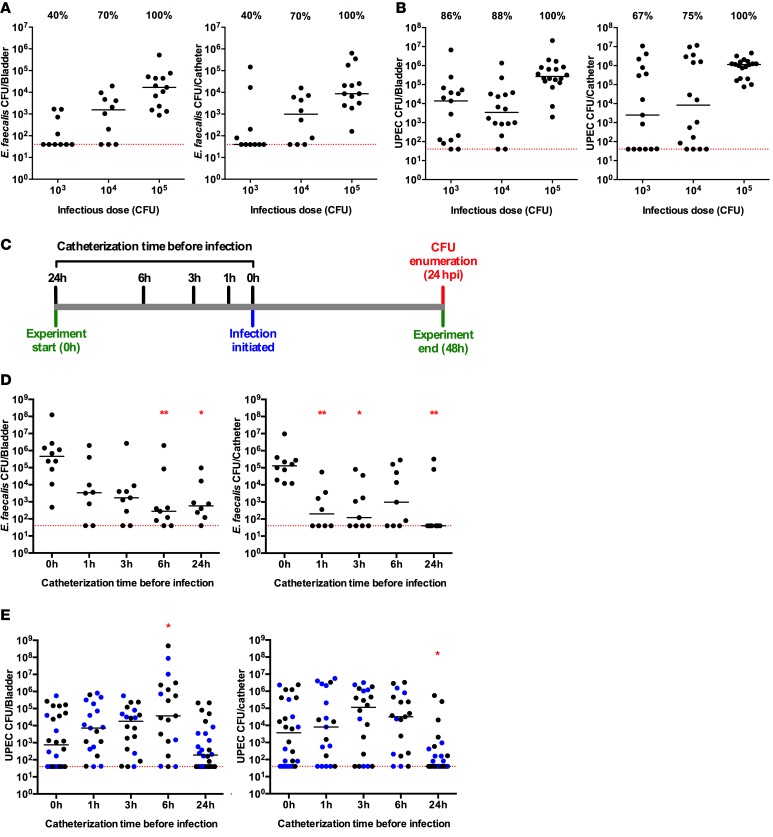
Figure 3. Susceptibility to infection by uropathogens is altered with increasing time after catheterization.
(A and B) Naive female C57BL/6 mice were implanted with catheters and infected with the indicated inocula of E. faecalis strain OG1RF or UPEC strain UTI89. Mice were sacrificed 24 hours after infection, and CFU per bladder and per catheter were determined for animals infected with (A) E. faecalis or (B) UPEC. (C) The schematic depicts the experimental approach used in D and E. Briefly, naive female mice were implanted with catheters and infected at the same time or at the indicated time point after catheterization with 1 × 10⁴ CFU of E. faecalis or UPEC. All animals were sacrificed 24 hours after infection, and CFU per bladder and per catheter were calculated for (D) E. faecalis or (E) UPEC. Each dot represents 1 mouse. Black dots represent animals that were colonized exclusively by the organism inoculated into the bladder. Blue dots indicate animals that were colonized by UPEC and another bacterial species, but the plotted value reflects only the UPEC CFU. The red dotted line represents the lower limit of detection. Experiments were performed 3–5 times (n = 5–10 mice per experimental group) and pooled. The presence of the catheter was verified at the time of sacrifice, and mice without a catheter were excluded from the analysis. *P < 0.05, **P < 0.01 for experimental groups compared with the control 0 h group, Kruskal-Wallis test with Dunn’s post-test to correct for multiple comparisons.

