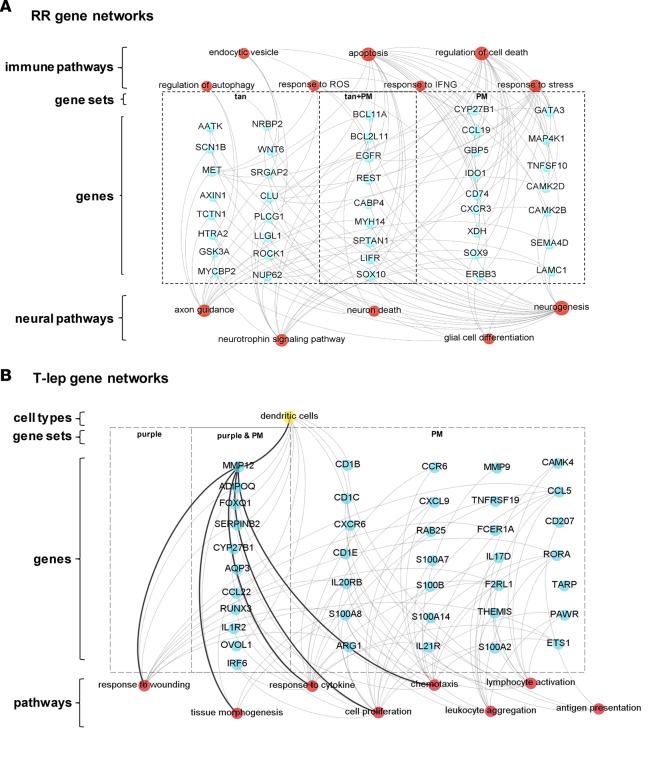
Figure 6. Specific networks for clinical subtypes of leprosy (T-lep and RR).
Gene ontology, KEGG pathway, and Reactome analysis were performed with ClueGO (Cytoscape software) for the most relevant WGCNA modules and the top 250 genes of the proportional median (PM) list for each leprosy clinical subtype. Genes selected from gene sets composed of either PM lists or WGCNA modules were overlapped with the top 250 genes in the specific cell-type signatures related with (A) RR and (B) T-lep. Connections were visualized by Gephi software. Blue circles represent genes, red circles denote immune functions, yellow circles show cell type, and gray lines represent connections between genes and immune functions and/or cell types. (A) RR function analysis shows genes (blue circles) connected with immune and neural biology (red) functions. RR, reversal reaction; T-lep, tuberculoid leprosy.

