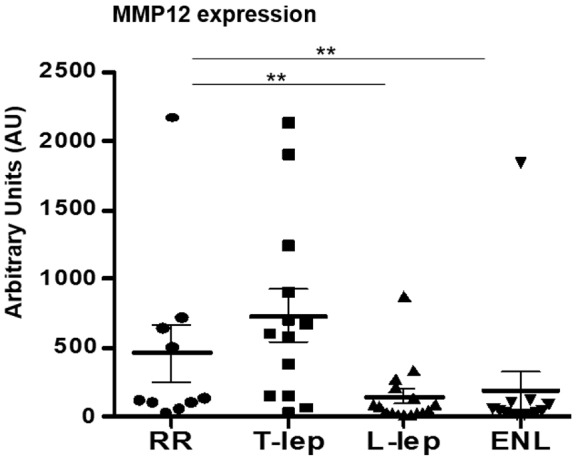
Figure 7. MMP12 regulation in leprosy.

Distribution of MMP12 mRNA by microarray analysis of skin lesions shown in arbitrary units (AU). The graph shows the total number of samples per clinical subtype (mean and SEM). Data represent mean ± SEM, RR = 10 (457.2 ± 207.2 AU), T-lep = 13 (732.7 ± 186.3 AU), L-lep = 16 (143.2 ± 54.41 AU), and ENL = 12 (186.3 ± 138.6 AU). Significance was determined by Kruskal-Wallis test (nonparametric ANOVA style test) using GraphPad Prism software and post-hoc analysis (Dunn’s multiple comparison test). **P < 0.01. ENL, erythema nodosum leprosum; L-lep, lepromatous leprosy; RR, reversal reaction; T-lep, tuberculoid leprosy.
