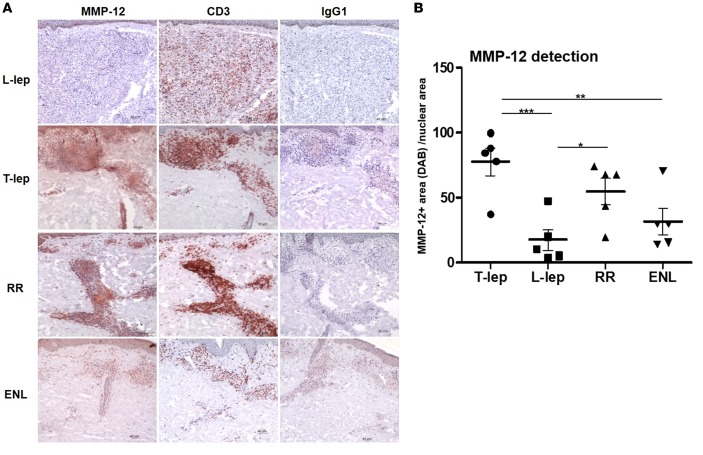
Figure 8. MMP-12 expression in leprosy lesions.
MMP-12 protein expression was evaluated in leprosy lesions (T-lep, L-lep, RR, and ENL). (A) CD3 expression was used as a marker for T cells, and IgG1 was used as a negative control; 1 representative labeled section is shown of at least 5 (each obtained from a different patient). Scale bar: 40 μm. Original magnification: ×100. (B) Automated image analysis of MMP12 protein expression. Each dot represents the percentage of MMP-12–stained area (diaminobenzidine [DAB]) per nuclear area for each individual photomicrograph (n = 5 for each group). Data represent mean ± SEM, T-lep (77.5 ± 10.7), L-lep (17.8 ± 8), RR (54.76 ± 10.2), and ENL 13 (32.14 ± 10.2). One-way ANOVA analysis was performed (P = 0.0004) using GraphPad Prism software, and post-hoc analysis (Bonferroni test) is indicated (*P < 0.05, **P < 0.01, ***P < 0.001). ENL, erythema nodosum leprosum; L-lep, lepromatous leprosy; RR, reversal reaction; T-lep, tuberculoid leprosy.

