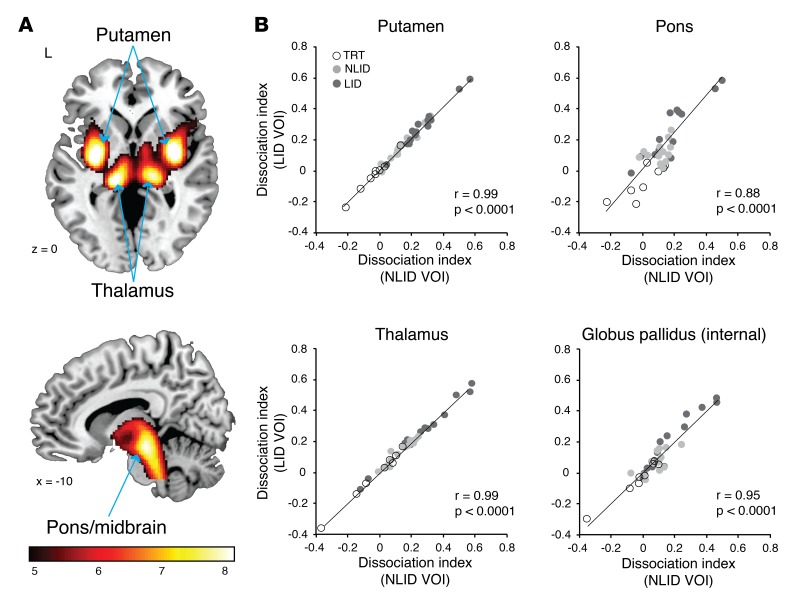
Figure 2. Dissociation of vasomotor and metabolic drug responses in an independent Parkinson’s disease sample.
(A) We analyzed cerebral blood flow (CBF) and cerebral metabolic rate (CMR) scans acquired ON and OFF levodopa infusion from 14 Parkinson’s disease subjects with levodopa-induced dyskinesia (LID) and found significant dissociation of vasomotor and metabolic response to levodopa in regions near those identified in the non-LID-based (NLID-based) analysis (Figure 1A). Regional dissociation effects identified in the LID-based analysis were generally greater in magnitude and more bilateralized than those seen in their NLID counterparts. Clusters were displayed using a red–yellow scale thresholded at T = 4.50 (P < 0.05, family-wise error-corrected, with cluster extent >100 voxels), superimposed on a single-subject MRI template. (B) Dissociation index (DI) values were highly correlated (r = 0.88–0.99, P < 0.0001, regression analysis) for each of the significant dissociation regions identified in the independent LID- and NLID-based analyses. For each of the significant regions identified in the 2 analyses, volumes of interest (VOI) coordinates representing the peak voxel of the corresponding NLID- and LID-based clusters are provided on the x- and y-axis labels, respectively. For each region, individual DI values computed in the NLID- and LID-based VOIs are separately displayed for the 14 LID (dark gray), 14 NLID (light gray), and the 8 test-retest (TRT) (open circles) subjects.

