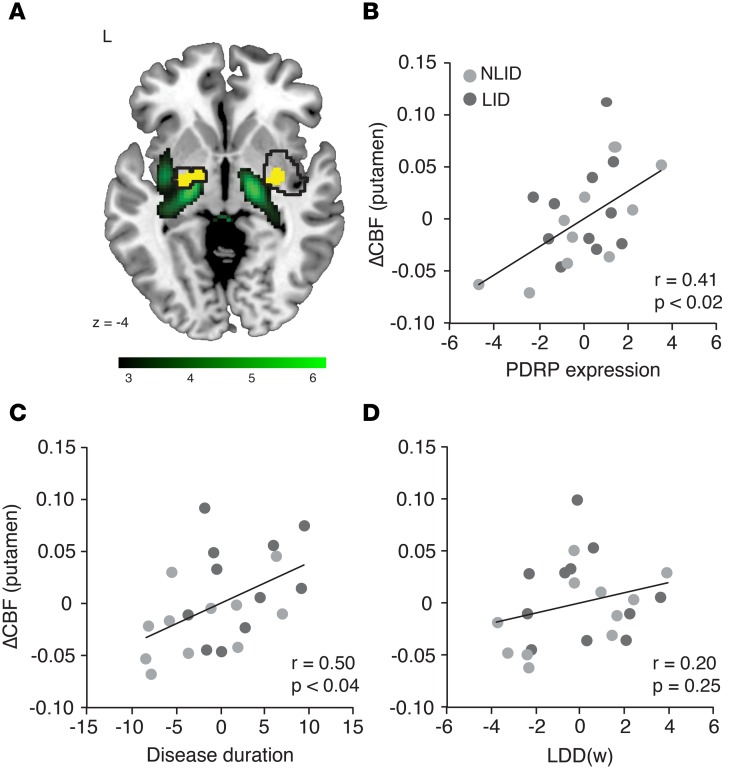
Figure 6. Clinical and network correlates of the putamen vasomotor response to levodopa.
Multiple regression analysis was performed to evaluate the relationship between vasomotor levodopa response (ΔCBFON-OFF) measured in the putamen dissociation region and independent descriptors of disease progression and chronic levodopa exposure (see Methods). In addition to disease duration and weight-corrected levodopa daily dose [LDD(w)], the model included off-state expression of the PD-related metabolic covariance pattern (PDRP), a metabolic network descriptor of disease progression measured over the entire brain (see text). (A) There was a striking spatial overlap (yellow) between PDRP regions with relatively increased metabolic activity (green) and areas with significant levodopa-mediated dissociation effects in the putamen (black contours). Positive voxel weights on the PDRP topography were thresholded at T = 3.12, P < 0.001, uncorrected, for the putamen. The display was overlaid on a standard MRI template. (B–D) Partial correlation leverage plots of the combined levodopa-induced dyskinesia (LID) (dark gray) and non-LID (NLID) (light gray) sample (n = 11 each) illustrate the unique effect of each predictor on the putamen vasomotor response to levodopa. (B) In accord with the observed spatial overlap, off-state PDRP expression exhibited a significant independent relationship with the putamen vasomotor response. (C) There was a significant relationship between the local dopaminergic vasomotor response and disease duration. (D) Levodopa dose [LDD(w)] was not a significant predictor of putamen ΔCBF.

