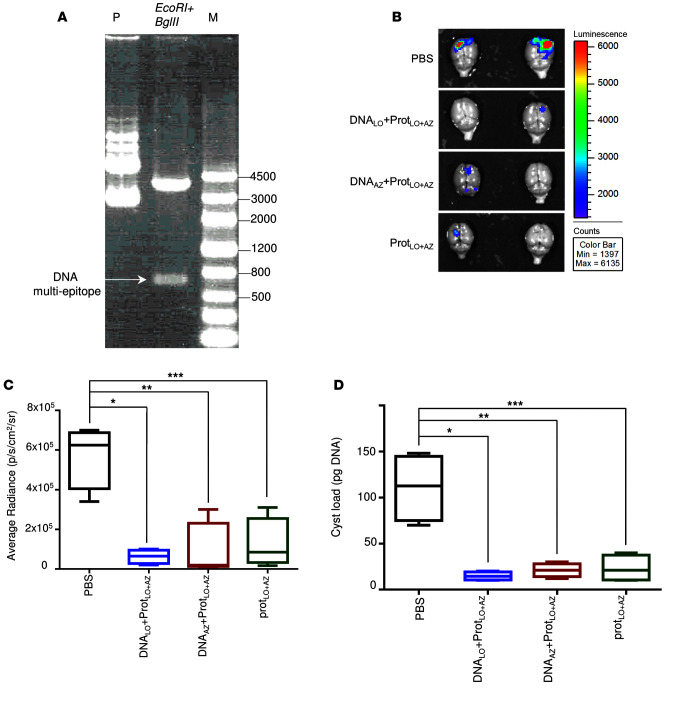
Figure 6. DNA prime-protein boost regimen.
(A) pMB75.6 vector used as a DNA vaccine vector for this study. Lane P: pMB75.6 plasmid; lane 2: pMB75.6 plasmid digested with EcoRI and BglII; lane M: KB ladder. (B) T. gondii brain cysts luciferase expression was reduced in HLA-A*11:01 mice immunized with DNA/ protein boost at 21 days after challenge with 2,000 T. gondii ME49-Fluc (Type II) expressing luciferase. (C) Xenogen imaging of brain ex vivo following the injection of luciferin into the retro-orbital plexus and then exposure of the brain to luciferin solution. n = 5 per group, *P = 0.0008, **P = 0.004, ***P = 0.004 (Student’s t test after one-way ANOVA). (D) Enumeration of cysts was performed with brains of mice challenged 21 days after final immunization. These experiments were performed at least 2 times, and one representative experiment of 2 is shown:.n = 5 control and 5 immunized mice. *P = 0.002, **P = 0.003, ***P = 0.004; Student’s t test was used to compere the groups. For C and D, the plots show median, with box extending from the 25th to 75th percentile and the whiskers extending from minimum and maximum values of the data set. One-way ANOVA was performed before the Student’s t test to determine whether there was an overall difference between the groups.

