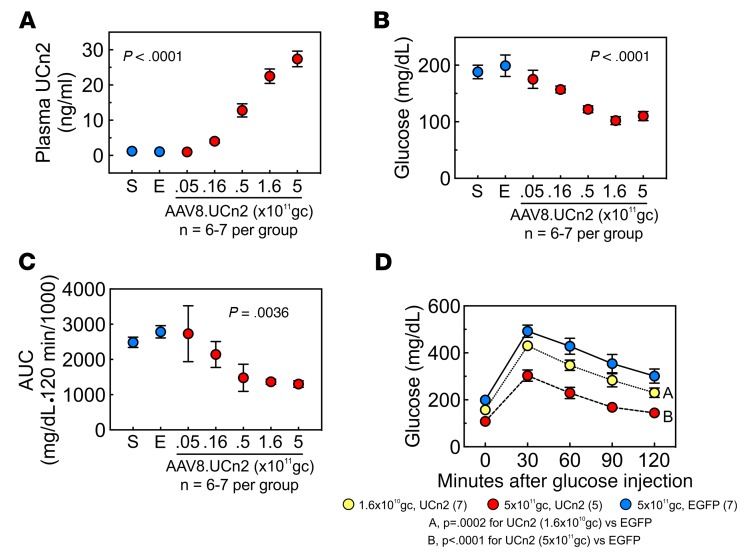
Figure 8. AAV8.UCn2 dose-response relationship.
The effects of AAV8.UCn2 dose on plasma levels of UCn2 and glucose disposal were examined 9 weeks after institution of HFD. (A) AAV8.UCn2 dose vs. plasma UCn2 concentration. AAV8.UCn2 doses of 5 × 10⁹ to 5 × 10¹¹ gc i.v. produced a dose-related increase in plasma UCn2 levels (P < 0.0001, 1-way ANOVA). Plasma obtained 75 ± 5 days after delivery. (B) Fasting glucose. Fasting blood glucose was related to AAV8.UCn2 dose (P < 0.0001, 1-way ANOVA). (C) Vector dose and glucose tolerance testing. The effects of AAV8.UCn2 on glucose disposal were dose dependent (P = 0.0036, 1-way ANOVA). Shown is area under the glucose-time curve for each dose. (D) Highest and lowest effective AAV8.UCn2 dose. Shown are glucose concentrations after i.v. glucose load in 3 of the 7 groups shown in C: AAV8.EGFP (control, 5 × 10¹¹ gc, i.v.), and 2 doses of AAV8.UCn2, i.v.: 5 × 10¹¹ gc (the highest dose) and 1.6 × 10¹⁰ gc, the lowest effective dose. In A–C: S, saline; E, AAV8.EGFP 5 × 10¹¹ gc i.v.

