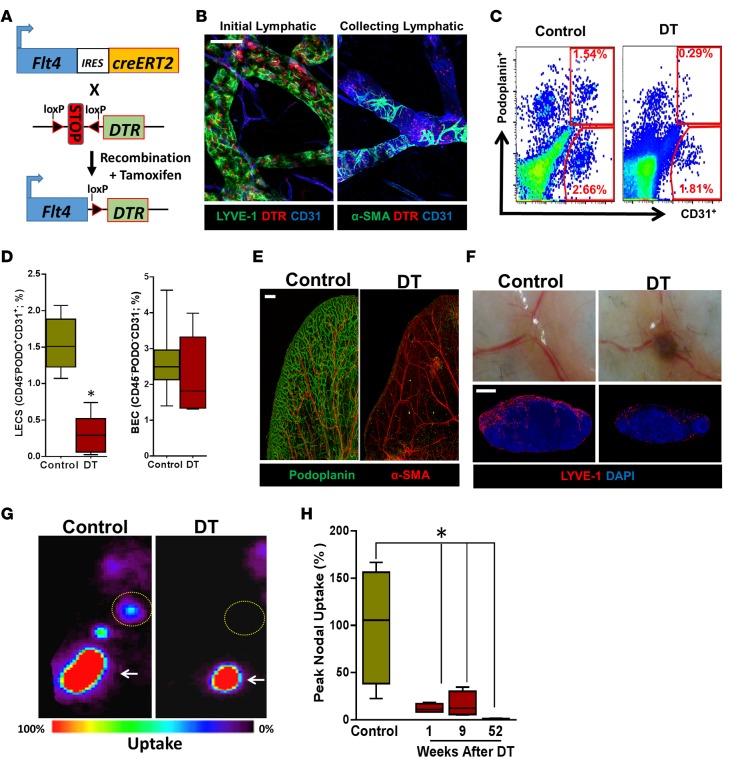
Figure 1. FLT4-Cre-DTR enables selective ablation of capillary and collecting lymphatics.
(A) Schematic diagram of the inducible Cre-recombinase system. Downstream of FLT4, there is an internal ribosome entry site (IRES) gene, followed by Cre recombinase and estrogen receptor type 2 (ERT2), which induces genetic recombination to place the floxed DTR gene downstream of FLT4 in response to tamoxifen administration. (B) Immunofluorescence staining of the ear skin shows colocalization of DTR with initial lymphatics (LYVE-1+) and collecting lymphatics (CD31+ with patchy α-SMA+ coverage; scale bar: 50 μm). (C) Representative flow cytometry dot plots for LECs (CD45–PODO+CD31+) and BECs (CD45–PODO–CD31+) in inguinal (i.e., subcutaneous) lymph nodes harvested 24 hours after i.p. DT administration. PODO, podoplanin. (D) Quantification (%) of LECs and BECs from flow cytometry of inguinal lymph nodes 24 hours after i.p. DT administration (n = 4–5 animals/group; LECs, *P < 0.05 and BECs, P = NS). (E) Representative whole mount immunofluorescence staining of ear skin localizing podoplanin and α-SMA in control and DT-treated mice. Note virtually complete ablation of capillary and collecting lymphatics. (F) Top row: Gross images of popliteal lymph nodes harvested 1 week after subcutaneous DT injection in the hind limb, with resultant lymph node hemorrhage. Bottom row: Representative photomicrographs of LYVE-1 immunofluorescence localization in popliteal lymph nodes 1 week after hind limb DT injection, showing destruction of the subcapsular and medullary lymphatics (scale bar: 400 μm). (G) Top row: Representative lymphoscintigraphy heat maps and peak nodal uptake of technetium-99m (99mTc) in the popliteal lymph nodes (yellow dotted circles) of control versus DT after unilateral hind limb injection (injection site is marked by arrows). (H) Quantification of the peak nodal uptake of 99mTc in the popliteal lymph node after DT administration for control and 1, 9, and 52 weeks (n = 4/group; *P < 0.05). Note the decreased peak nodal uptake following DT administration. 2-tailed Student’s t test, ANOVA with post hoc comparison tests.

