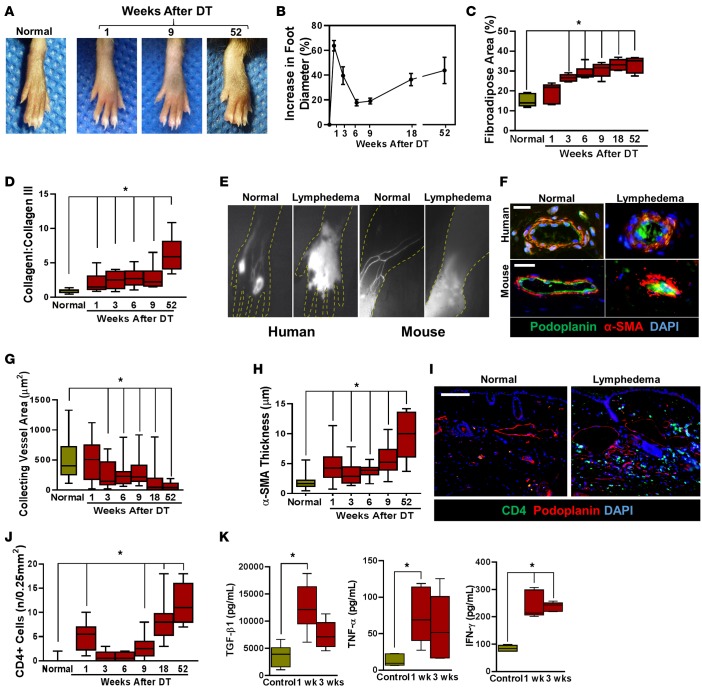
Figure 2. Subcutaneous injection of DT leads to development of chronic lymphedema that models clinical lymphedema temporally, histologically, and radiographically.
(A) Representative photographs of mouse hind limbs at 1, 9, and 52 weeks following DT injection as compared with normal (i.e. nontreated) mice. (B) Quantification of increasing foot diameter from baseline after DT administration over the course of the study (n = 5–6/group). (C) Quantification of fibroadipose area for histological sections from 1, 3, 6, 9, 18, and 52 weeks (*P < 0.001). (D) Quantification of scar index (collagen I:collagen III) from foot histological sections for each time point (*P < 0.001). (E) Left panels: NIR lymphangiography in human hands showing normal uptake (left) and dermal backflow with loss of lymphatics in the setting of lymphedema (right). Right panels: NIR lymphangiography of normal (left) and lymphedematous mouse hind limbs (52 weeks after lymphatic ablation; right). Note the similarity of the pattern to clinical disease. (F) Top row: Representative photomicrograph showing immunofluorescence staining of collecting lymphatic vessels (podoplanin+, green; α-SMA+, red) in normal human skin and lymphedematous skin (scale bar: 40 μm). Note the sclerosed collecting vessel in the lymphedematous tissue. Bottom row: Representative photomicrograph showing immunofluorescent staining of collecting lymphatic vessels (podoplanin+; green and α-SMA+; red) in normal mouse hind limb skin and DT treated skin (scale bar: 40 μm). Note decreased luminal area and increased wall thickness in the lymphedematous tissue. (G) Quantification of collecting lymphatic vessel area at different time points after lymphatic ablation (*P < 0.001). (H) Quantification of α-SMA thickness at different time points after lymphatic ablation (*P < 0.001). (I) Representative photomicrographs localizing CD4 and podoplanin in distal mouse hind limb tissues in age-matched normal and DT-treated animals (52 weeks after DT; scale bar: 100 μm). (J) Quantification of CD4+ cells in control and DT-treated mice 52 weeks after lymphatic ablation (*P < 0.001). (K) ELISA for TGF-β1, TNF-α, and IFN-γ in hind limb tissues harvested from control an DT-treated mice 1 and 3 weeks after DT injection (*P < 0.01). 2-tailed Student’s t test.

