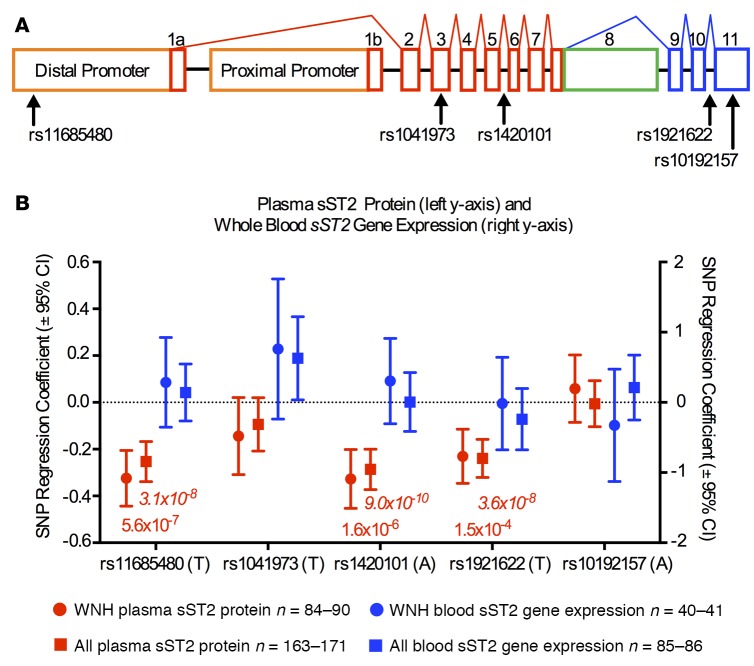
Figure 2. Single nucleotide polymorphisms (SNPs) in the IL1RL1 gene influence plasma protein sST2 levels but not whole blood cell sST2 expression.
(A) Schematic showing the IL1RL1 gene transcript structure highlighting 5 candidate expression quantitative trait loci (eQTL) SNPs. Blue exons are specific to the ST2L transcript, green exons are specific to the sST2 transcript, and red exons are shared by both transcripts. The distal promoter can produce both the long ST2L and the short sST2 transcript, while the proximal can produce only the short sST2 transcript. (B) sST2 plasma protein levels (red) as measured by liquid chromatography-mass spectroscopy (LC-MS) are associated with 3 SNPs in the IL1RL1 gene: rs11685480, rs1420101, and rs1921622 in white non-Hispanic subjects only (WNH) and among the entire cohort (All). The tested allele in all cases is associated with lower-circulating sST2 levels. None of the tested SNPs was an eQTL for sST2 expression in whole blood RNA (blue). SNP regression coefficient and the corresponding 95% CIs are plotted with P values listed below. Additive linear regression models were used. Nonitalicized P values indicate the WNH, while the italicized P values shown for the entire cohort (All).

