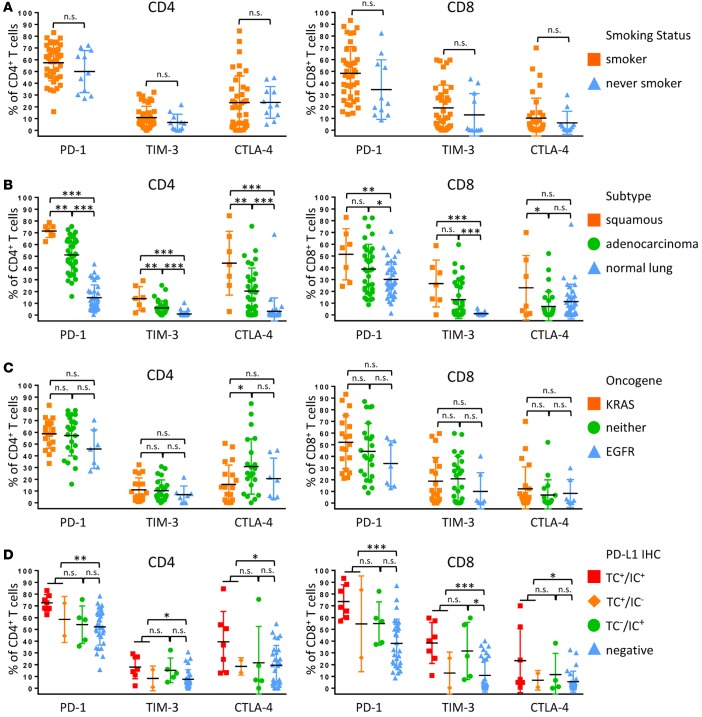
Figure 4. T cell expression of inhibitory receptors by clinical features.
Percentage of expression of inhibitory receptors PD-1, TIM-3, and CTLA -4 by CD4+ T cells (left) and CD8+ T cells (right) based on smoking history (A), histological subtype (B), oncogene status (C), and PD-L1 immunohistochemical scoring (D) of tumor cells (TC+) and immune cells (IC+). Data for bar graphs were calculated using unpaired Student’s t test with. *P < 0.05; **P < 0.01; ***P < 0.001. Mean with SD. Two-way ANOVA CD4+ T cells: smoker vs. never smoker, P = 0.2314; adenocarcinoma vs. squamous, P < 0.0001; adenocarcinoma vs. normal lung, P < 0.0001; squamous vs. normal lung, P < 0.0001; EGFR vs. KRAS, P = 0.2450; KRAS vs. neither, P = 0.1272; EGFR vs. neither, P = 0.0619; TC+ vs. IC+, P = 0.1038; TC+ vs. negative, P < 0.001; IC+ vs. negative, P = 0.3626. Two-way ANOVA CD8+ T cells: smoker vs. never smoker, P = 0.0433; adenocarcinoma vs. squamous, P = 0.0017; adenocarcinoma vs. normal lung, P = 0.0083; squamous vs. normal lung, P < 0.0001; EGFR vs. KRAS, P = 0.0759; KRAS vs. neither, P = 0.9649; EGFR vs. neither, P = 0.0972; TC+ vs. IC+, P = 0.2742; TC+ vs. negative, P < 0.0001; IC+ vs. negative, P = 0.0025.

