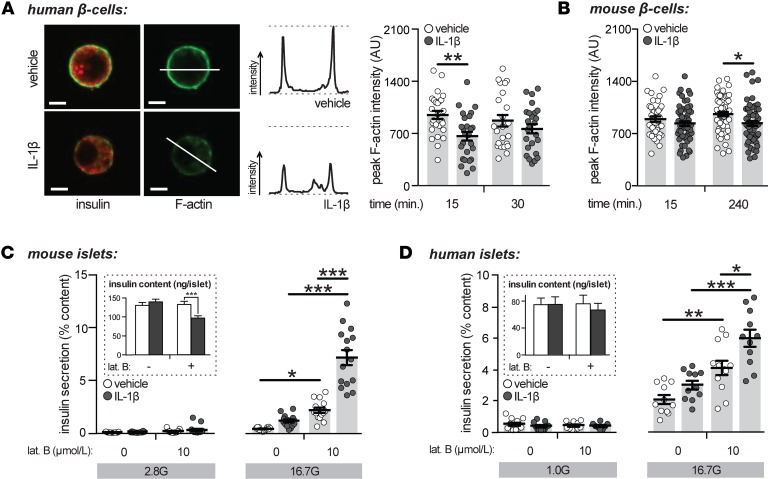
Figure 3. Acute treatment with IL-1β induces filamentous-actin depolymerization.
(A) Dispersed human β cells treated with vehicle or IL-1β (10 ng/ml) in the presence of 2.8 mmol/l glucose, as indicated, and stained for insulin (red) or filamentous actin (F-actin; green). Representative images (left; 15-minute treatment), example line scan analysis (middle), and quantification of average peak F-actin intensities (right) as arbitrary units (AU) are shown (n = 26, 27, 23, 25 cells; 4 donors). Scale bars represent 5 microns. (B) As in A but with dispersed mouse β cells (n = 39, 58, 58, 60 cells; 3 experiments). (C) Insulin secretion normalized to percent insulin content from mouse islets treated with IL-1β (10 ng/ml; 4 hours) and/or latrunculin B (lat. B; 10 μmol/l; 1 hour) and stimulated with 2.8 (2.8 G) or 16.7 (16.7 G) mmol/l glucose (n = 15, 14, 15, 15, 14, 15, 14, 15; 5 experiments). Insulin contents are shown (inset). (D) As in C but with human islets treated with IL-1β (2 hours) and lat. B (1 hour) (n = 12, 11, 11, 8, 11, 11, 12, 11; 4 donors) and stimulated with 1.0 (1.0 G) or 16.7 (16.7 G) mmol/l glucose. n values correspond to data points from left to right, respectively. Data are mean ±SEM and were compared with 2-way ANOVA followed by Tukey post-test. *P < 0.05, **P < 0.01, and ***P < 0.001, as indicated. G, glucose.

