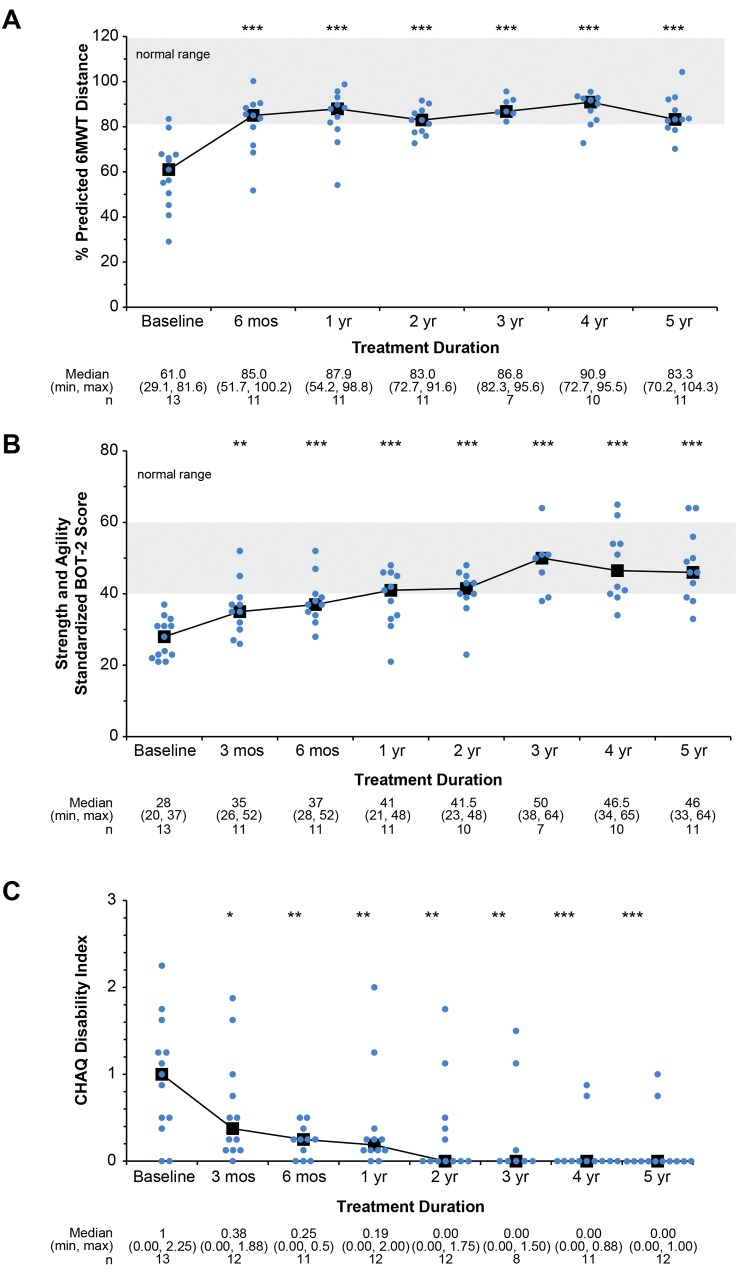
Figure 6. Functional assessment during treatment with asfotase alfa.
(A) Percent predicted 6MWT distance median achieves the normal range after 6 months of treatment and is sustained at 5 years of therapy. P ≤ 0.0005 by paired t test for the mean difference between each time point and baseline. (B) Gross motor function, assessed using the BOT-2 Running Speed and Agility subtest (17), shows median scores reaching the normal range (gray area) by 1 year of treatment that were sustained. Median, min, max, and n values are given within the figure. (C) Disability assessment using the CHAQ (24) shows patient improvement. *P ≤ 0.05, **P ≤ 0.01, ***P ≤ 0.001 mean difference for each time point compared with baseline by paired t test. Median, min, max, and n values are given below each figure. For all graphs, individual dots indicate individual patient scores at each time point. Gray area represents the normal range.

