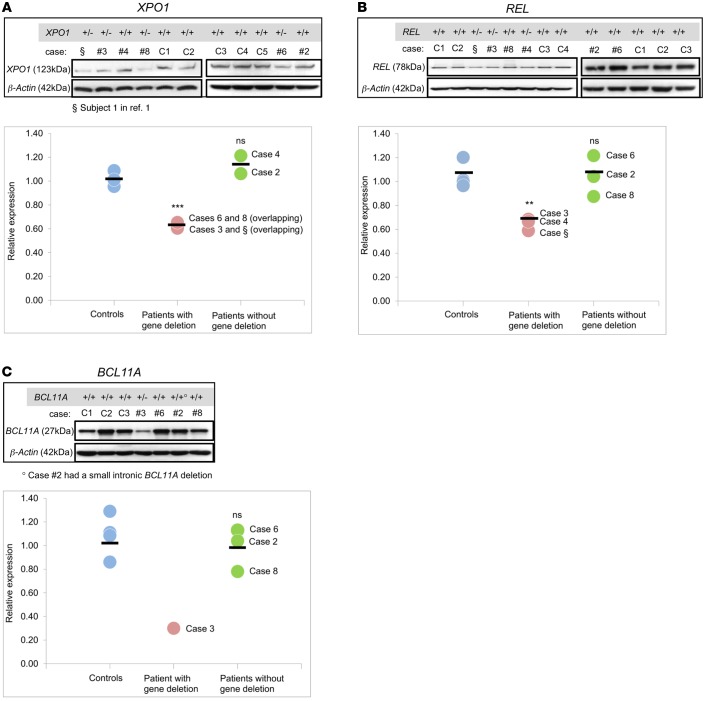
Figure 3. Protein expression analysis of XPO1, REL, and BCL11A in patients’ cells.
Expression of (A) XPO1, (B) REL, and (C) BCL11A was analyzed in the lymphoblast cell lines (LCLs) from patients (with and without gene deletions) and controls by Western blotting, and the subsequent quantitative measurement of protein density was done using GeneSnap image acquisition software (Syngene). Each data point represents the average of the ratios of normalized protein density compared with the internal loading control from independent biological replicates (n = 3 per individual). ***P < 0.001; **P < 0.01; and NS = P > 0.05, by 2-tailed Student’s t test. §, Subject 1 in ref. 1. #, case (patient) number. C1, control 1, etc.

