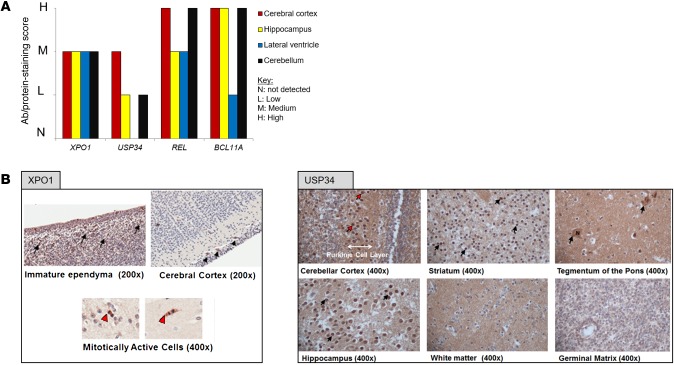
Figure 5. Protein expression analysis of XPO1, USP34, REL, and BCL11A in human brain.
(A) Bar graph illustrating expression levels of all 4 genes in 4 different brain regions. Data were obtained from The Human Protein Atlas database (http://proteinatlas.org). N, not detected; L, low; M, medium; H, high. (B) Human fetal brain immunohistochemical staining performed against XPO1 and USP34. For XPO1, mild positivity was seen in immature ependyma or neuroepithelium (black arrows); in the cerebral cortex, positivity was seen in Cajal-Retzius cells (black arrowheads); in immature ependymal cells undergoing mitosis (overlying the germinal matrix), positivity was stronger and associated with the mitotic spindle (red arrowheads). For USP34, strong positive staining was visible in the Purkinje cell layer of fetal brain cerebellar cortex (red arrows), while moderate positivity was seen throughout gray matter in the striatum, tegmentum of the pons, and hippocampus (black arrows); USP34 was diffusely expressed in neurons and could be seen in both the nucleus (N) and cytoplasm (black arrows) for large neurons in the tegmentum of the pons. No staining was visible in white matter or germinal layers. Original magnification, ×200 and ×400, as shown below each image.

