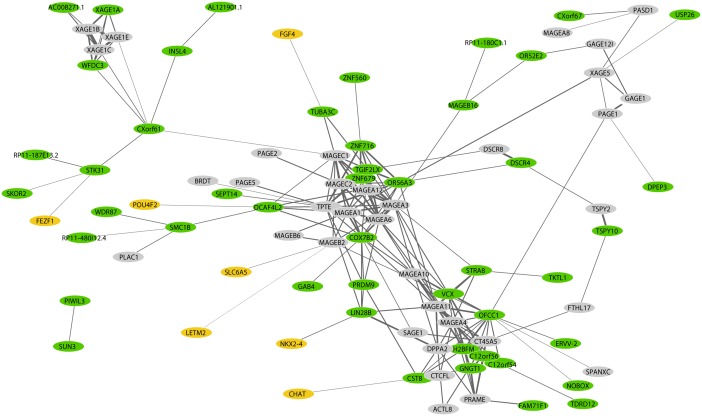
Figure 9. Network analysis of cancer testis antigens (CTAs) in non–small-cell lung cancer (NSCLC).
A network analysis illustrating the coexpression pattern of the 90 identified CTAs. The genes previously identified as CTAs from the CTdatabase are marked in gray, the newly identified genes are marked in green, and the newly identified genes that are also expressed in neuronal tissue according to the Genotype-Tissue Expression are marked in yellow.

