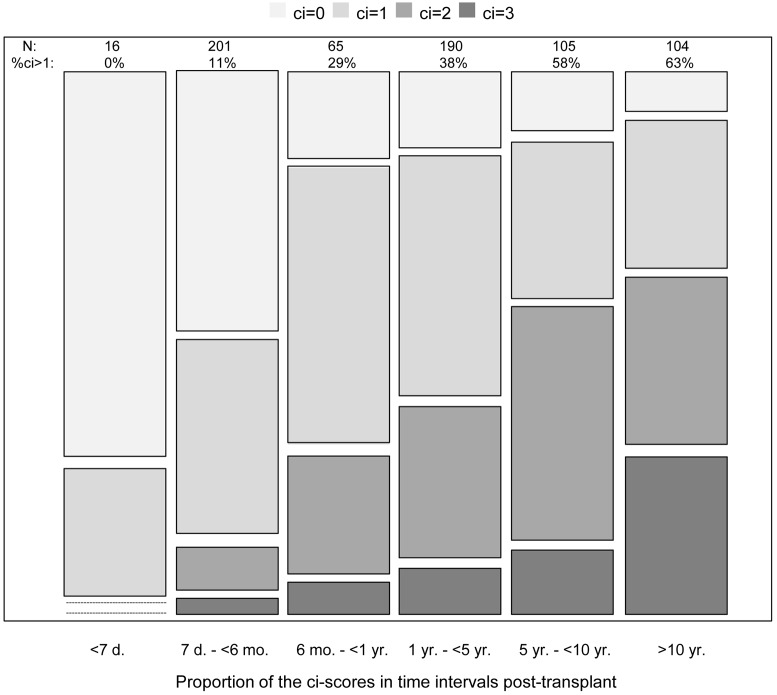
Figure 1. Relationship between the histologic scores for fibrosis and time after transplant to biopsy.
Distribution of fibrosis lesions (ci scores) in time intervals after transplant. The block height represents the number of biopsies with each ci score in each time interval. d, days after transplant; mo, months after transplant; yr, years after transplant; N, number of biopsies in each time interval; and %ci>1, percentage of biopsies with ci score >1 in each time interval.

