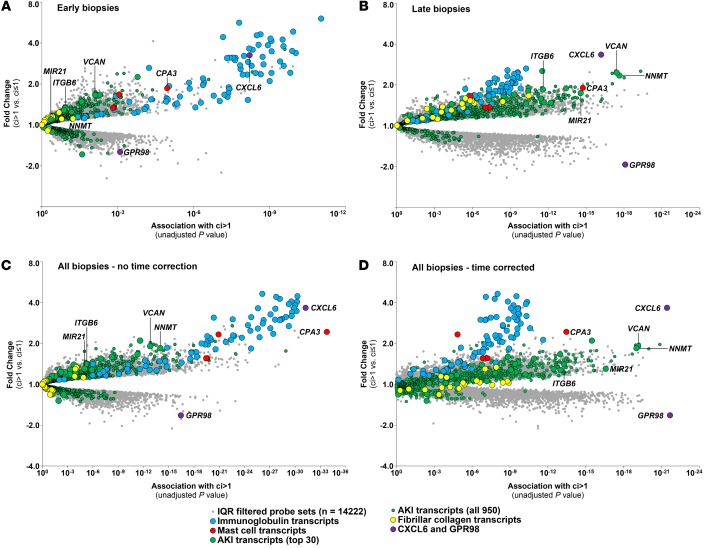
Figure 5. The dependence of the global transcript landscape of atrophy-fibrosis on time after transplant (TxBx).
The association strength of all interquartile range–filtered (IQR-filtered) probe sets to atrophy fibrosis (ci score >1) as tested by the Bayes t test. Probe sets belonging to the following transcript set were labeled as follows: mast cell transcripts (MCATs), red circles; immunoglobulin transcripts (IGTs), blue circles; acute kidney injury (AKI) transcripts top 30, green circles; all 950 AKI transcripts (IRRAT950), small green circles; fibrillar collagen (FICOL) transcripts, yellow circles; and remaining IQR filtered probe sets, gray dots. Each symbol represents an individual probe set. (A) biopsies taken before 1 year TxBx (n = 282). (B) Biopsies taken after 1 year TxBx (n = 399). (C) All biopsies (n = 681). (D) All biopsies with TxBx correction (n = 681).

