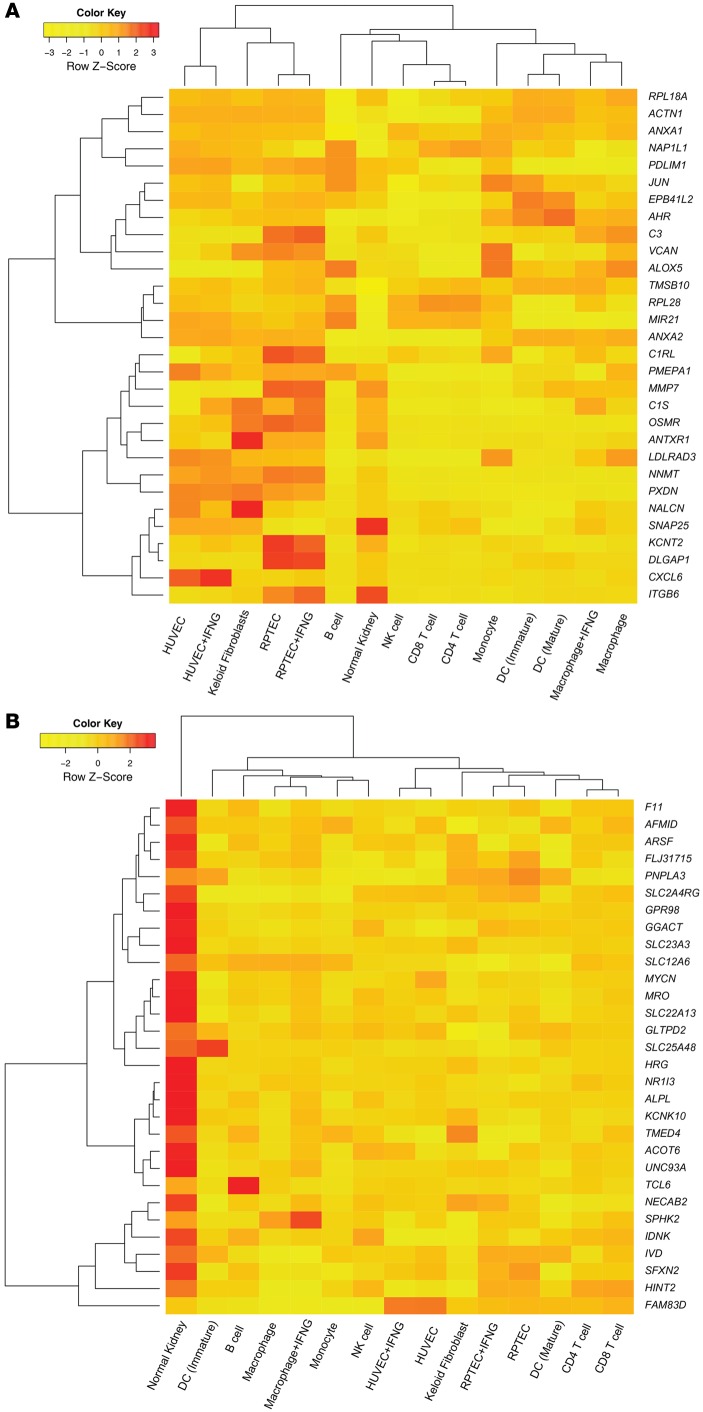
Figure 6. Expression of the top 30 TxBx-corrected transcripts associated with high fibrosis across the panel of cultured cells compared with normal kidney control.
(A) Hierarchical clustering of the top increased transcripts. (B) The top decreased transcripts. Rows represent z-scores of transcripts, and columns represent cell types. Hierarchical clustering was done on rows and columns using Euclidean distance as the similarity measure with a full linkage. Human renal tubular epithelial cells, RPTEC; human umbilical vein endothelial cells, HUVEC.

