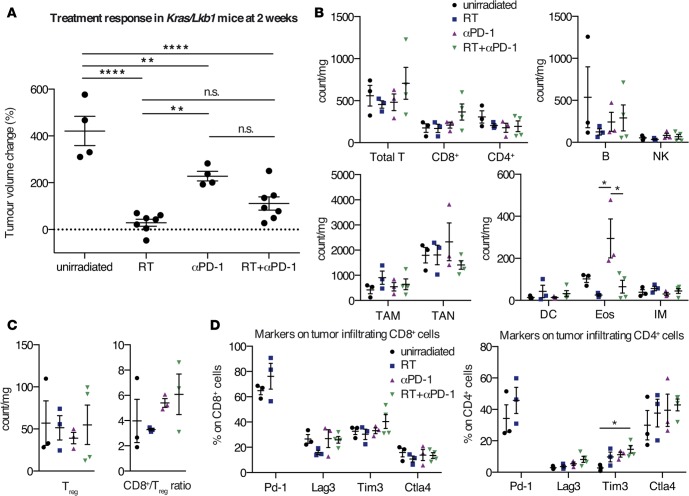
Figure 5. Phenotyping of tumor-associated immune cell populations after RT, αPD-1, and combination therapy in Kras/Lkb1-mutant murine NSCLC.
(A) Treatment response of unirradiated (n = 4) and RT- (n = 7), αPD-1– (n = 4), and RT+αPD-1–treated (n = 7) mice at 2 weeks. Each dot represents one mouse. Data of the RT cohort was partly published previously (8). (B) Representative flow cytometry data (live/single/total CD45+ cells). Total numbers of tumor-infiltrating lymphoid cells and myeloid cells of tumors from indicated treatment groups. (C) Total number of tumor-associated Tregs of indicated treatment groups. CD8+/Treg ratio was calculated from B and C. (D) Expression of inhibitory T cell markers on CD8+ and CD4+ T cells of indicated treatment groups. PD-1 expression could not be measured in αPD-1–treated tumors due to antibody binding. Representative data are shown conducted with 3 unirradiated and 3 RT-treated, 3 αPD-1–treated, and 4 dual-treated mice (B–D). Data are represented as mean ± SEM. P values were calculated using 1-way ANOVA with Tukey’s multiple comparisons test. ****P < 0.0001; **P<0.01; *P < 0.05. RT, radiation therapy; PD-1, programmed cell death 1; TAM, tumor-associated macrophages; TAN, tumor-associated neutrophils; Lag3, lymphocyte-activation gene 3; Tim3, T cell immunoglobulin and mucin-domain containing-3; Ctla4, cytotoxic T-lymphocyte–associated protein 4.

