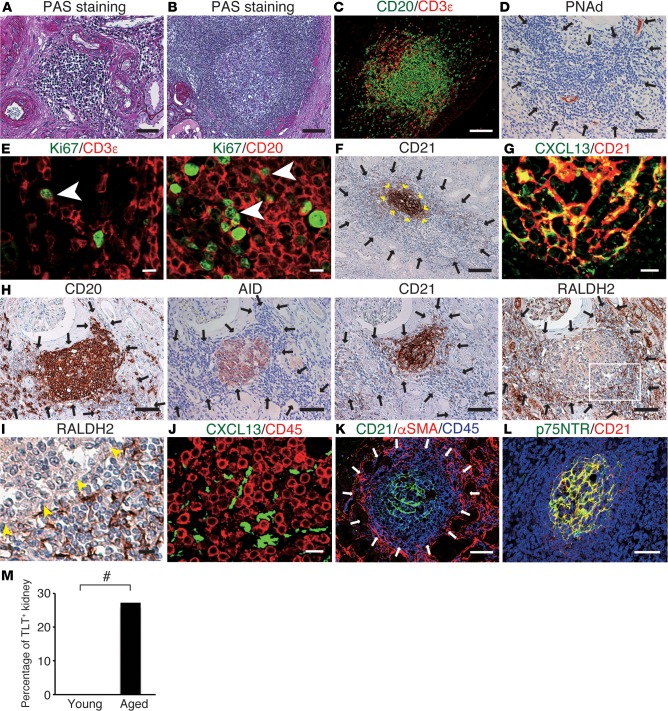
Figure 7. Tertiary lymphoid tissues (TLTs) form in aged human kidneys.
(A–L) Histological analyses of aged human kidney samples. (A and B) Periodic acid-Schiff (PAS) staining and immunofluorescence analysis of (C) CD20 and CD3ε; (E) Ki67 and CD3ε/CD20 (arrowheads indicate double-positive cells); (G) CXCL13 and CD21; (J) CXCL13 and CD45; (K) CD21, α-smooth muscle actin (αSMA), and CD45; and (L) p75 neurotrophin receptor (p75NTR) and CD21, and immunohistochemical analysis of (D) peripheral lymph node addressin (PNAd); (F) CD21 (arrowheads indicate the localization of CD21+ follicular dendritic cell [FDC] networks); (H) CD20, activation-induced cytidine deaminase (AID), CD21, and retinaldehyde dehydrogenase 2 (RALDH2) (serial sections); and (I) RALDH2 (arrowheads indicate the localization of B cell follicles). The outlined region in (H) is magnified in (I). Arrows indicate TLT localization. Scale bars: (A, D, H, K, and L) 50 μm, (B, C, and F) 100 μm, (E, G, I, and J) 10 μm. (M) Quantitative analysis of TLT frequencies in human samples (n = 56; young = 13, aged = 43). #P < 0.05 (Pearson’s χ2 test).

