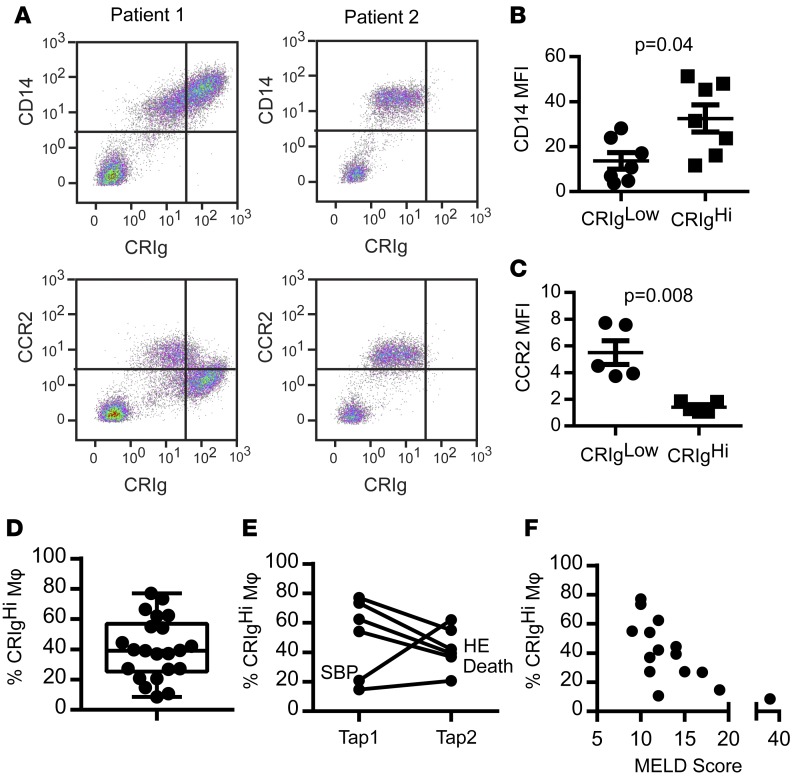
Figure 1. CRIg defines a subpopulation of macrophages in ascites fluid.
(A) Representative plots showing CD14, CRIg, and CCR2 expression on cells obtained from ascites fluid from 2 cirrhotic patients. CD14–/CRIg– lymphocytes are shown for reference; however, CD14+ macrophages were gated for analysis of fluorescence intensity. (B) CD14 (n = 6) and (C) CCR2 (n = 5) median fluorescence intensity (MFI) on CRIghi and CRIglo macrophages. (Mann-Whitney test). (D) Proportion of CD14+ ascites cells expressing CRIg in ascites fluid (n = 22, box represents 5th to 95th percentile, with whiskers indicating minimum and maximum values and the line at the median). (E) Longitudinal variation in the proportion of CD14+ ascites cells expressing CRIg. Clinically significant events are annotated (n = 6, approximately 3 months between paracenteses [“taps”] for each patient). SBP, spontaneous bacterial peritonitis; HE, hepatic encephalopathy. (F) Correlation between the proportion of CD14+ ascites cells expressing CRIg and MELD score (n = 15, spearman r = 0.74, P = 0.002).

