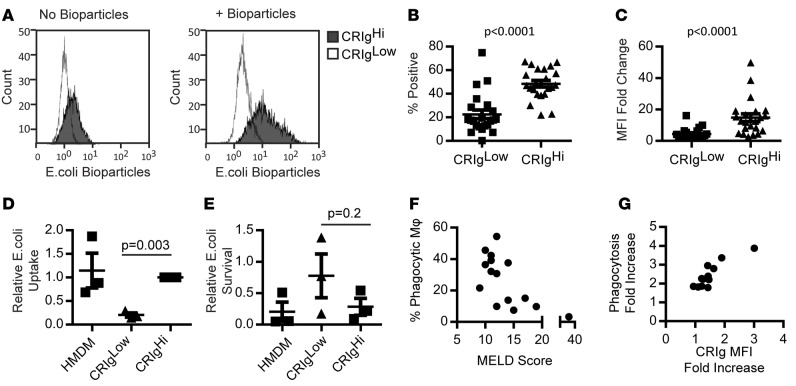
Figure 3. Increased microbial phagocytic capacity in CRIg+ macrophages.
(A) Representative histograms showing CRIghi and CRIglo fluorescence in the absence and presence of pHRodo E. coli bioparticles. (B) Proportion of CRIghi and CRIglo macrophages phagocytosing E. coli bioparticles and (C) change in median fluorescence intensity (MFI) with uptake (n = 22, Mann-Whitney test). (D) E. coli phagocytosis (CFU/ml 1 hour after infection, relative to CRIghi macrophages) (n = 3, 1-sample t test) and (E) killing capacity (proportion of phagocytosed E. coli [1 hour] surviving at 4 hours) in CRIghi CRIglo and human monocyte-derived macrophages (HMDM) (n = 3, Mann-Whitney Test). Dot plot data in B–E represent mean ± SEM. (F) Correlation between ascites fluid macrophage phagocytic capacity and MELD score (n = 15, spearman r = 0.65, P = 0.009). (G) Correlation between increased CRIg expression and phagocytic capacity in the presence of autologous ascites fluid (fold change compared with incubation in culture medium) (n = 12, spearman r = 0.87, P = 0.0002).

