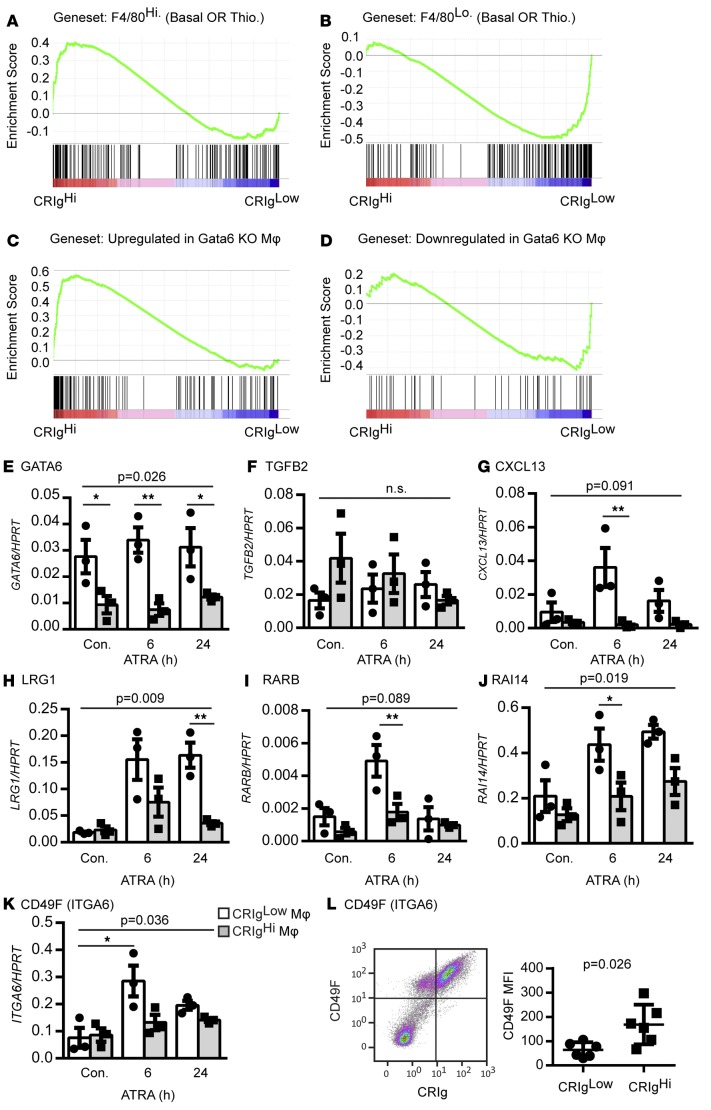
Figure 6. Relationship between human and murine peritoneal macrophage signatures.
(A and B) Murine peritoneal macrophage-specific gene set enrichment with respect to the ascites fluid macrophage profile. Ascites macrophage data are ranked according to differential expression between subpopulations (indicated by red-blue bars), and the gene set of interest is mapped onto this profile (black bars) to determine enrichment score (green lines) (Thio., thioglycollate). Enrichment of genes (C) upregulated and (D) downregulated in murine Gata6-deficient macrophages in ascites macrophages (GSEA analysis as in A). Relative expression of (E) GATA6, (F) TGFB2, (G) CXCL13, (H) LRG1, (I) RARB, (J) RAI14, and (K) CD49F in CRIghi and CRIglo macrophages stimulated with ATRA (n = 3, repeated-measures 2-way ANOVA followed by Sidak multiple comparison test for differences between macrophage populations or time point). (A–J) ANOVA P values for the effect of macrophage population or (K) ATRA stimulation on gene expression; *P < 0.05, **P < 0.01. (L) Mean fluorescence intensity (MFI) of CD49F surface expression on ascites macrophage populations (Mann-Whitney test, n = 6) and representative dot plot. Dot plot data represent mean ± SEM.

