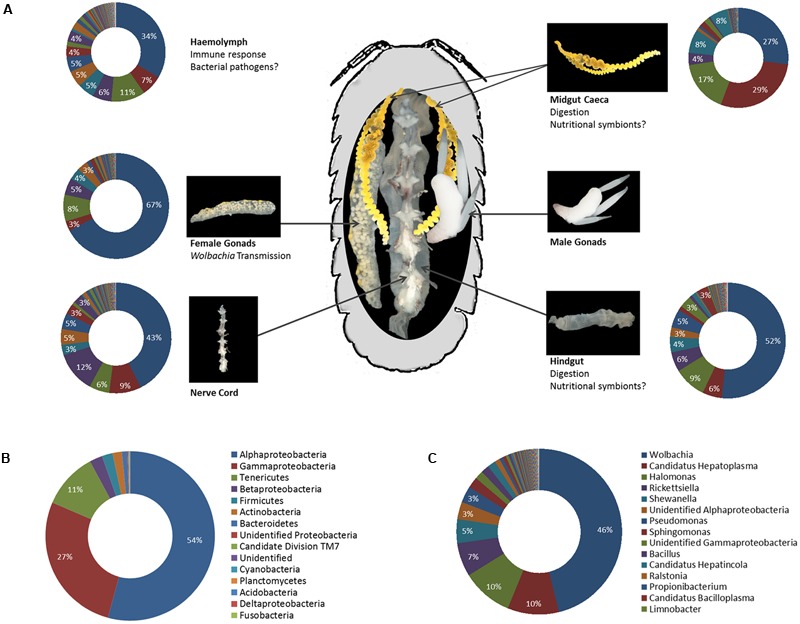
FIGURE 5.

(A) Representation of the microbiota in different tissues of A. vulgare (modified from Dittmer et al., 2016). Note that data from males and females are combined, therefore the chart illustrating the microbiota in the gonads represents both male and female gonads. The legend for all charts is the same as in (C). (B,C) The microbiome of A. vulgare for all tissues combined, at the phylum (B) and genus (C) level. Proteobacteria are represented at class level. Legends show the 15 most abundant phyla/classes and genera, respectively.
