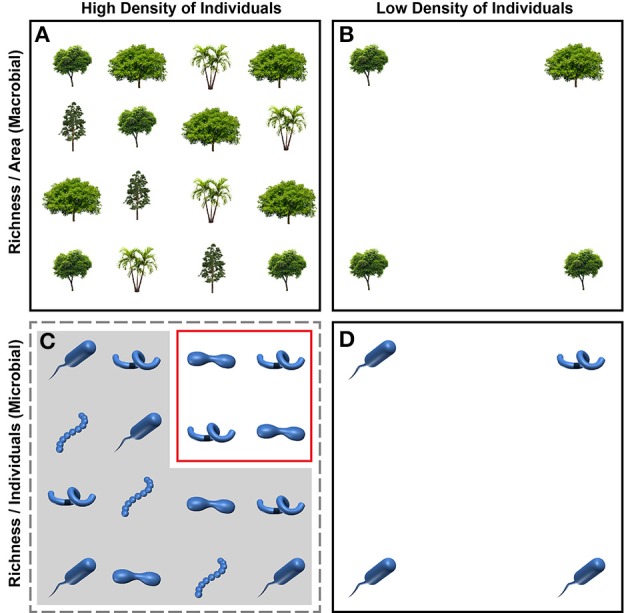
Figure 1.

Conceptual depiction of approaches for estimating species or OTU richness in macrobial (A,B) and microbial (C,D) ecology; each icon represents one individual. In macrobial ecology, richness is often estimated by keeping the area sampled constant across communities (A,B); richness estimates are therefore expressed as number of species per area, regardless of how many individuals are found within a given plot size. In the top panels, richness per area is 4 and 2 in the plots with a high (A) and low (B) density of individuals, respectively. In microbial ecology, OTU richness is often estimated by keeping the number of sampled individuals constant across communities (C,D); richness estimates are therefore expressed as number of OTUs per individual, regardless of how the density of individuals varies across communities. Although there are more individuals per area in panel (C) relative to panel (D) most of those individuals are excluded (indicated by gray overlay) in the estimation of OTU richness; only the individuals in the red box are used in the richness estimate. Richness per individual is therefore 0.5 for both high and low density plots (2 taxa per 4 individuals sampled). This difference in how richness is quantified causes disconnect between patterns observed in microbial systems and theory developed in macrobial ecology.
