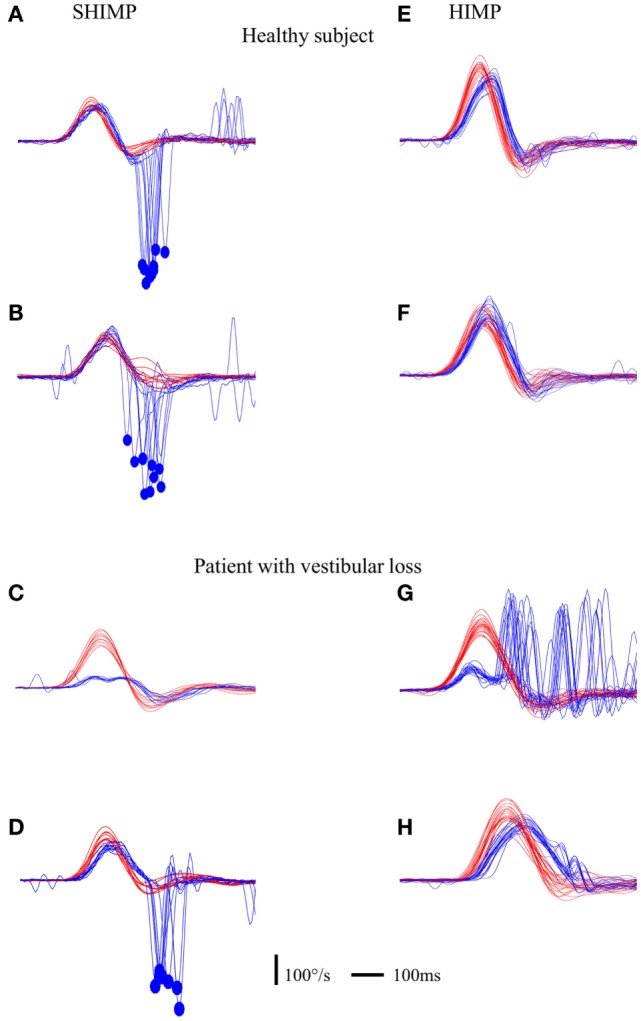
Figure 2.

Illustration of compensatory and anti-compensatory saccades obtained in SHIMP and HIMP procedures, respectively. (A–D) SHIMP raw data in a normal subject when the head impulse was directed toward the left (A) and right (B) side and in a complete UVL patient when the head impulse was directed toward the right lesioned (C) and left intact (D) side. (E,F) HIMP raw data in a normal subject when the head impulse was directed toward the left (E) and right (F) side and in a complete UVL patient when the head impulse was directed toward the right lesioned (G) and left intact (H) side. Red curve: head velocity; blue curve: eye velocity; blue circle: peak saccade velocity; vertical bar: 100°/s; horizontal bar: 100 ms.
