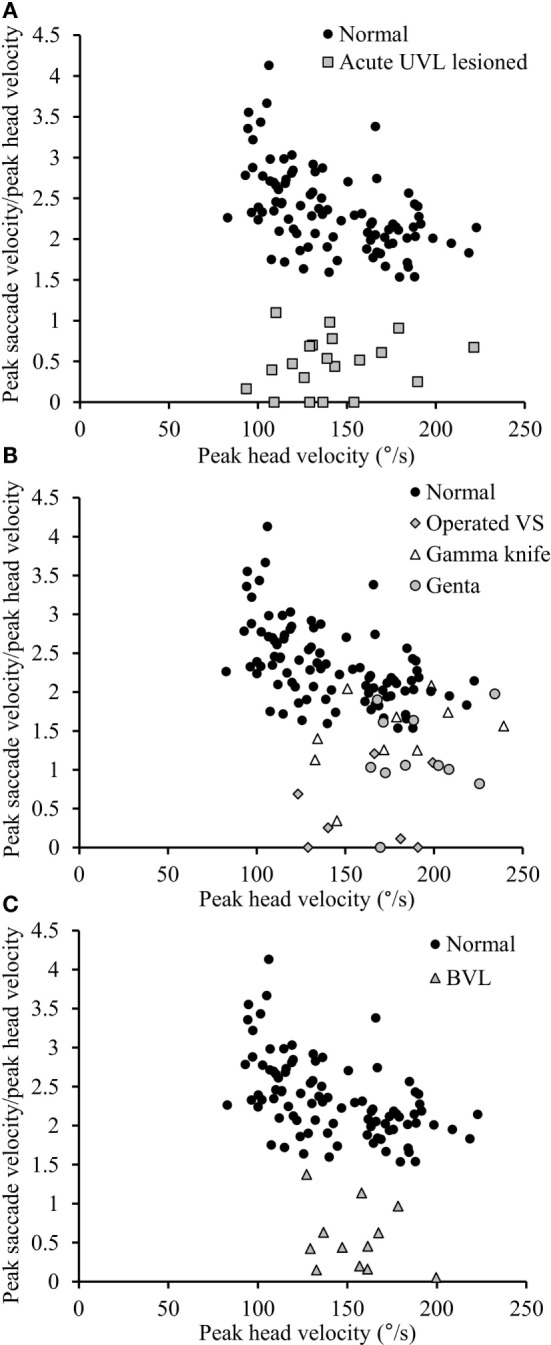
Figure 5.

Relationship between peak saccade velocity and peak head velocity. (A) The ratio between peak saccade velocity (°/s) and peak head velocity (°/s) is close to 2.5 in normal subjects (black circles), whereas it is lower than 1.10 in acute UVL patients (gray squares). (B) The ratio varies from 0 to normal values in chronic UVL patients. Notice that normal values were only seen in some patients treated with gamma-knife therapy because of unilateral vestibular schwannoma (empty triangle) or patients suffering from Meniere’s disease and treated by intratympanic gentamycin injections (gray circles), but not patients with vestibular schwannoma operated after 6 weeks (gray diamonds). (C) The ratio in BVL patients (gray triangles) is lower than 1.37.
