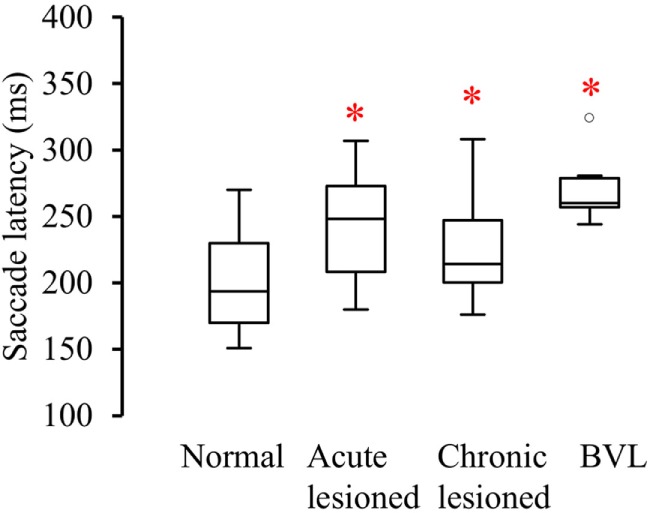
Figure 6.

Latency between the start of head turn and the start of the anti-compensatory saccade (ms) in normal subjects, acute UVL, chronic UVL, and BVL patients. The bottom and the top of the box represent the 25th and 75th percentiles, and the band within the box represents the 50th percentile. The ends of the whiskers represent the maximum and minimum of all the data. Asterisks indicate significantly increased saccade latency in the lesioned side of acute UVL patients (p < 0.005), the lesioned side of chronic UVL patients (p < 0.02), and BVL patients (p < 0.0001).
