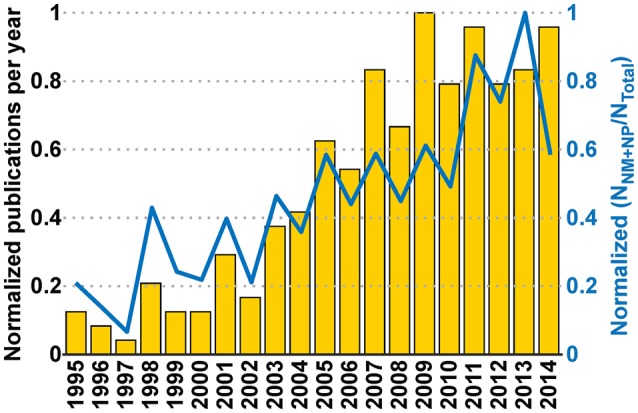
Figure 9.

Interaction between communities and its effect on the Neurobiohybird publications. The bar plot (left Y-axis) shows the normalized publication frequencies calculated by extracting relevant publications through “interaction keywords”-based querying (see Section Analysis of Database) of the XML database. The increasing trend of the publication frequencies from two subcommunities (“Neuromimetics” and “Neuroprosthetics”) associated to the Neurobiohybrid field demonstrates a growing interaction between them. The interaction effect on the Neurobiohybrid publications is evident in the line plot (right Y-axis) which reports the yearly normalized ratios between subsets of publications resulting from the interactions (NNM+NP) and total number of journal publications in the Neurobiohybrid field (NTotal).
