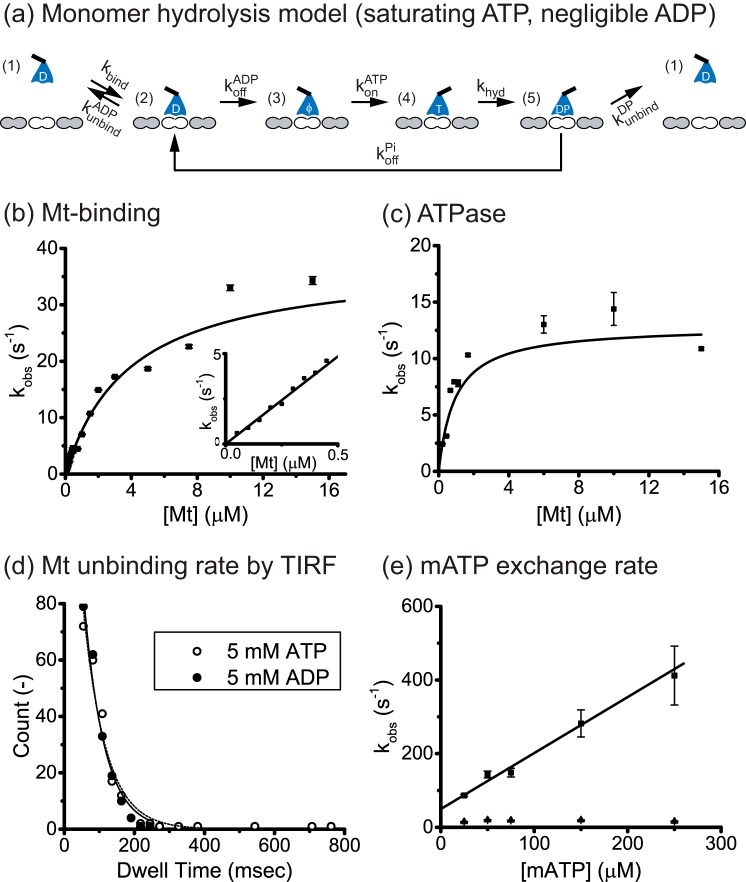
FIGURE 1.
Eg5 monomer kinetics. a, monomer hydrolysis model. Monomeric motors in solution (state 1) bind reversibly to the Mt (state 2), and release their bound ADP to generate a strongly bound state (state 3). In sufficient ATP and negligible ADP, ATP binds (state 4) and is hydrolyzed (state 5). If the motor detaches in the ADP-Pi state, 1 ATP is hydrolyzed per Mt encounter. Alternatively, if the ADP-Pi state is strongly bound and/or Pi release is fast, then hydrolysis and detachment are not tightly coupled and futile hydrolysis cycles may occur (return to state 2). The number of futile cycle is determined in state 2 by the race between the ADP off-rate, koffADP, and the Mt-unbinding rate, kunbindADP. b, microtubule-stimulated mADP release. Eg5M incubated in mADP was flushed against varying Mt concentrations with 2 mm ATP added to prevent mADP rebinding. Transients (average of n = 5–7) were fit with a single exponential, and observed rates were plotted as a function of Mt concentration. Fitting to a hyperbola generated a maximal mADP off-rate of koffmADP = 37.8 ± 5.3 s−1 and half-max Mt concentration of K0.5Mt = 3.9 ± 0.7 μm Mt. Inset, blow up of the linear range of the curve with fit of effective bimolecular on-rate, kbiADP = 9.7 ± 0.2 μm−1 s−1. c, Mt-stimulated ATPase activity of Eg5M. From the hyperbolic fit (n = 4–5 determinations per point), kcat = 12.9 ± 1.9 s−1 and K0.5Mt = 0.93 ± 0.25 μm Mt. The calculated kbiATPase = kcat/K0.5Mt = 13.9 ± 4.3 μm−1 s−1, results in kbiratio = kbiATPase/kbiADP = 1.4 ± 0.4 ATP molecules hydrolyzed per Mt encounter. d, Mt-unbinding rates of QD655-conjugated Eg5M in saturating ATP (open circle and dashed curve) or ADP (solid circle and curve). Single-molecule dwell-time distributions were measured from movies taken at 40 frames/s, and binned data (excluding first 25-ms wide bin) were fit by single exponentials. Calculated monomer unbinding rates were kunbindATP = 15.6 ± 1.5 s−1 and kunbindADP = 17.0 ± 2.0 s−1. e, mATP exchange rate of the Eg5M-Mt complex. Fluorescence transients (average of n = 16–18) were fit with a bi-exponential and two rate constants plotted at varying mATP concentrations. Fitting the fast phase by linear regression yielded a slope corresponding to the on-rate of mATP to the motor-Mt complex, konmATP = 1.5 ± 0.2 μm−1 s−1. The slow phase had a rate in the range of 15 - 20 s−1, which is similar to the ATP turnover rate and was interpreted as hydrolysis after mATP binding rather than rapid unbinding. Both phases had similar amplitudes, and the amplitudes did not vary with mATP concentration.

