FIGURE 6.
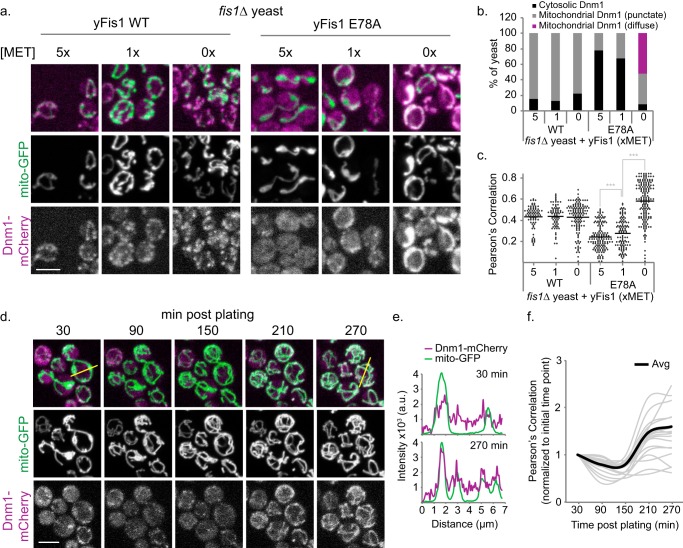
Increased E78A expression results in Dnm1 accumulation on mitochondria. a, representative confocal image projections from fis1Δ yeast expressing Dnm1-mCherry, mito-GFP, and either 1×HA-Fis1 WT or E78A that were grown overnight in medium containing 5× methionine; back-diluted into 5×, 1×, or 0× methionine medium (to induce Fis1 expression); and grown to mid-log phase. b, using the confocal image projections from a, Dnm1 localization was recorded as either cytosolic, mitochondrial with punctate Dnm1, or mitochondrial with circumscribing Dnm1 from at least 85 cells. c, Pearson's correlation co-localization index was determined for all of the cells from the experiment conducted for a. d, Fis1Δ yeast expressing Dnm1-mCherry, mito-GFP and 1×HA-Fis1-E78A were grown overnight in medium containing 5× methionine. The yeast were then back-diluted in medium containing 0× methionine, grown to mid-log phase, and plated on an agarose bed containing 0× methionine. A field of yeast containing existing Dnm1 puncta was imaged every hour for 5 h, assaying for the accumulation of Dnm1. e, line scan plots of Dnm1-mCherry (purple) and mito-GFP (green) from the yellow lines indicated on the 30- or 270-min merged image. f, Pearson's correlation was determined for each yeast cell in the image from d and tracked through the subsequent time points. Individual data are displayed in the gray line plots, whereas the black line represents the average from the 19 yeast cells imaged for the experiment. Scale bar, 5 μm. Note the initial time points were normalized to 1. ***, p < 0.001 (supplemental Table 2).

