FIGURE 2.
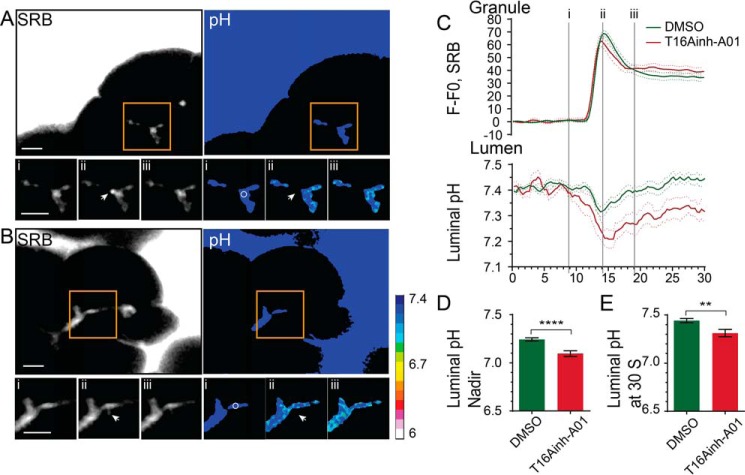
TMEM16A is a significant transporter of HCO3− in to the acinar lumen. A and B, two-photon live-cell imaging of pancreatic fragments bathed in HCO3− stimulated with CCK (10–20 pm) in the absence (DMSO control, A; see also supplemental Movies 5 and 6) or presence of 10 μm T16Ainh-AO1 (B, see also supplemental Movies 7 and 8). The SRB fluorescence shows an example granule fusion event (arrow). Also shown are pseudocolored pH changes as assessed with the HPTS fluorescence changes. C, D, and E, the inhibitor leads to a significant (Student's t test; ****, p < 0.001; **, p < 0.01) increase in stimulus-induced luminal acidification (n ≥ 10 events, n > 3 mice). Scale bars = 5 μm.

