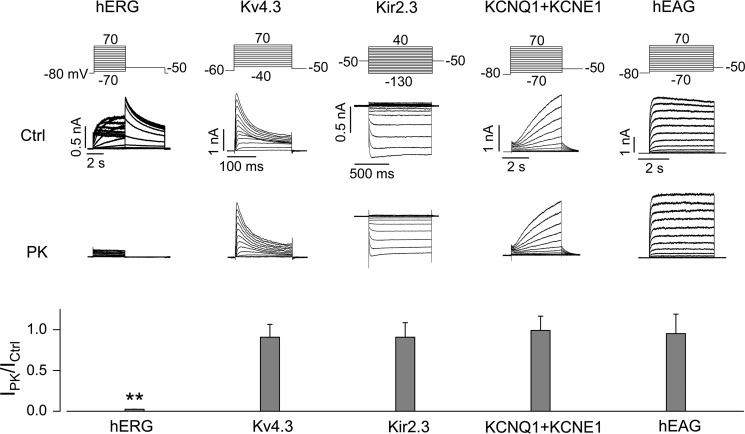
FIGURE 2.
Effects of PK on various currents of potassium channels stably expressed in HEK 293 cells. Families of hERG, Kv4.3, Kir2.3, KCNQ1 + KCNE1, and hEAG currents in control (Ctrl) and PK (200 μg/ml, 20 min)-treated cells along with the voltage protocols are shown. Specific channel currents recorded from each PK-treated cell are normalized to the mean value of corresponding currents recorded from control cells and summarized in the bar graph below the representative currents. **, p < 0.01 versus control. n = 7–16 cells from three independent treatments for each channel. Error bars, S.E.

