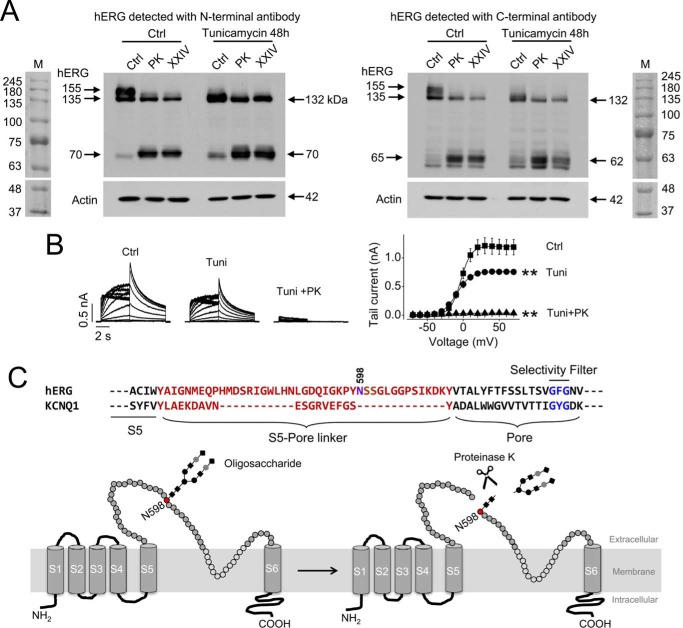
FIGURE 4.
PK cleavage of hERG channels. A, detection of hERG expression after PK (200 μg/ml, 20 min) or protease XXIV (XXIV; 200 μg/ml, 20 min) treatment in hERG-HEK cells in control (Ctrl) conditions or following culture with tunicamycin (10 μg/ml) for 48 h. hERG expression was detected using an N-terminal anti-hERG antibody (N-20, left) or a C-terminal anti-hERG antibody (C-20, right). M, molecular weight marker. B, families of hERG currents from control cells, tunicamycin-treated cells without or with PK treatment (left), and the summarized activation curves (right) in each condition. **, p < 0.01 versus control, maximal tail currents (n = 6 cells in each group). C, amino acid sequence alignment of S5-pore linker and pore region of hERG and KCNQ1. The S5-pore linkers of both channels are highlighted in red. The pore region and selectivity filter of each channel are highlighted in black and blue, respectively. The N-linked glycosylation site of hERG is marked at position 598. Below the sequences is an illustration depicting the potential site for PK-mediated cleavage. The S5-pore linker with N-linked oligosaccharide before and after PK cut is shown. Error bars, S.E.

