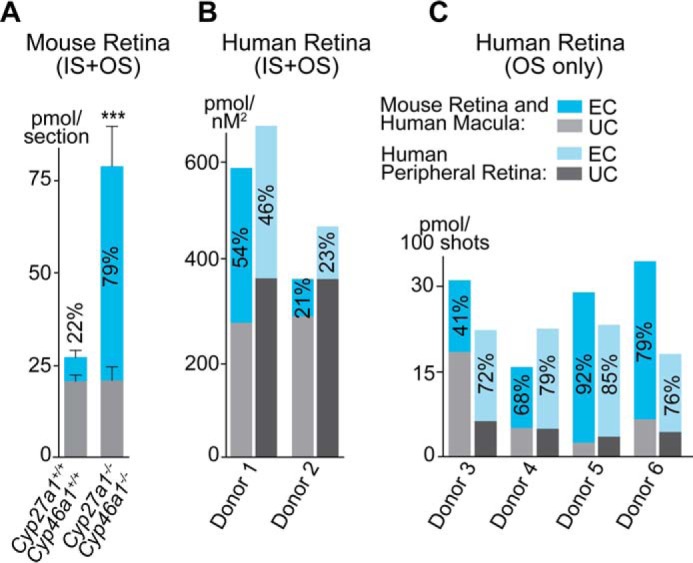
FIGURE 3.

UC and EC content in mouse and human PR cells. A, mouse retina. The results are mean ± S.D. of the measurements in three samples from one retina, each containing four dissectates of the PR area. B and C, human retina. The results are the mean of the measurements in two samples from one retina, each containing four dissectates (donors 1 and 2), and in one sample, each containing the material from 600–700 laser shots (donors 3–6). The numbers inside the blue bars are the EC content relative to total cholesterol. Data on total cholesterol in donors 3–6 were published previously in Ref. 5.
