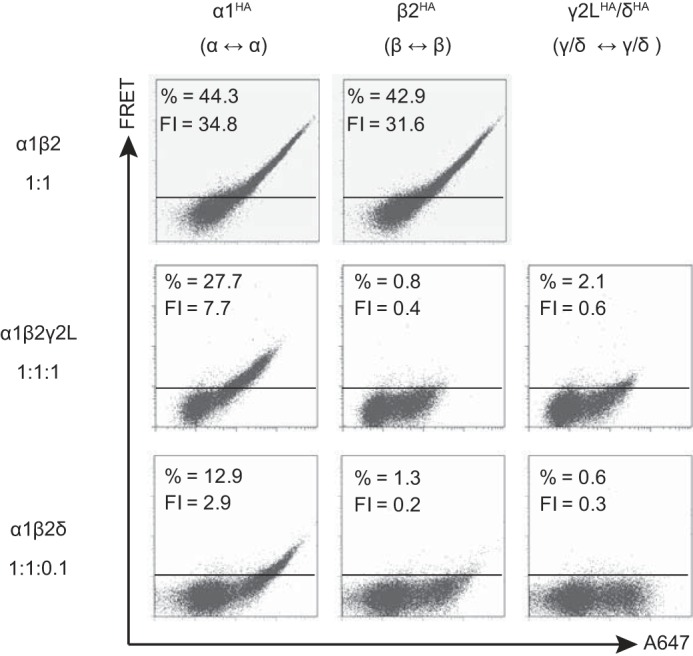
FIGURE 4.

Flow cytometric analysis of GABAA receptor γ2LHA and δHA subunit FRET with partnering α1 and β2 subunits when transfected at “expression-equivalent” levels suggested that γ2LHA and δHA subunits assembled in similar patterns. HEK293T cells were transfected with 1 μg of α1 subunit cDNA, 1 μg of β2 subunit cDNA, and either blank pcDNA vector or the amount of γ2LHA or δHA subunit cDNA that achieved maximal expression (Fig. 3). The α1 and β2 subunit cDNAs were co-transfected with 1 μg of pcDNA vector (top row), 1 μg of γ2LHA subunit cDNA (middle row), or 0.1 μg δHA cDNA + 0.9 μg of pcDNA vector (bottom row). To determine subunit adjacency, each subunit was individually HA-tagged, and cells were incubated with both anti-HA-Alexa-555 and anti-HA-Alexa-647 before being subjected to flow cytometry. The left column illustrates the α1-α1 subunit FRET signal (α1 HA-tagged); the middle column illustrates the β2-β2 subunit FRET signal (β2 HA-tagged); and the right column illustrates the γ2L-γ2L or δ-δ FRET signal. For all dot plots, the x axis indicates fluorescence intensity of the acceptor fluorophore (Alexa-647) when excited directly, and the y axis (FRET) indicates fluorescence intensity of acceptor fluorophore (Alexa-647) when only the donor fluorophore (Alexa-555) was excited. The horizontal line indicates the FRET threshold, defined such that less than 1% of cells are located above this line when stained with only acceptor fluorophore (i.e. where FRET was not possible). The percentage of cells emitting above this threshold is listed at the top of each dot plot along with the mean FRET fluorescence intensity (FI).
