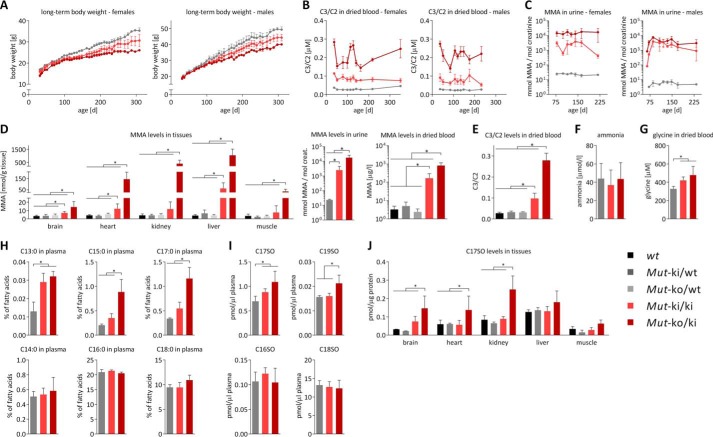
FIGURE 2.
Clinical and biochemical phenotype of Mutki/ki and Mutko/ki mice (genotypes see legend, data in panels D–J are derived from female animals). A, monitoring of body weight over time. Decreased body weight in female Mutki/ki mice is significant compared with Mutki/wt from day 162, and in Mutko/ki significant compared with Mutki/wt from day 114. For both, p < 0.05. B, C3 levels in dried blood spots normalized to C2. C, MMA levels measured by LC-MS/MS in urine collected overnight in metabolic cages. In A–C points represent mean values, error bars depict S.E. and n = 5/group. D, MMA levels in tissues (left panel), urine (middle panel), and dried blood (right panel), determined by tandem mass spectrometry. E, C3 levels normalized to C2 in dried blood. F, ammonia levels measured in whole blood. G, glycine concentration determined in dried blood by tandem mass spectrometry. H, fatty acid levels determined in plasma and expressed as percentage of total fatty acids. I, plasma levels of sphingoid bases (expressed as pmol/μl plasma). J, 17-carbon chain sphingoid base levels in different tissues expressed as pmol/μg protein. D–J, bars represent mean values from 35 days old mice (error bars depict S.D.; n ≥ 4; *, p < 0.05).

