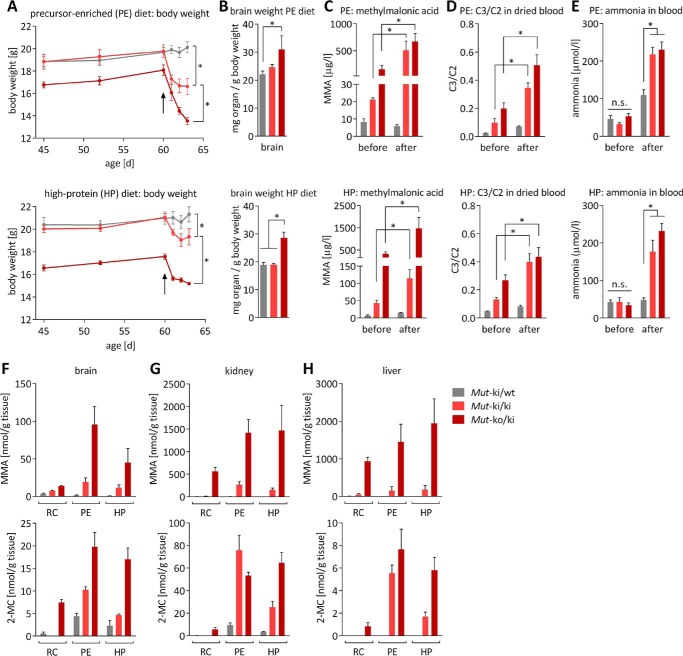
FIGURE 5.
Modified diet leads to disease acceleration. A, start of both modified diets at 60 days of age is indicated by the black arrows. Upper panel, PE; lower panel, HP. Monitoring of body weight showed significant differences among the three groups on day 63 for both diets. B, weight of brain normalized to body weight after diet study. C, MMA in dried blood. D, C3 (normalized to C2) in dried blood. E, whole blood ammonia before and after diet modification. F–H, MMA and 2-MC levels in homogenates of brain (F), kidney (G), and liver (H) tissue on RC, HP, and PE as determined by GC-MS. For all panels, from five animals for each genotype, bars and points represent means; error bars are S.E. For A–E, *, p < 0.01; n.s., not significant; statistics were not calculated for F–H.

