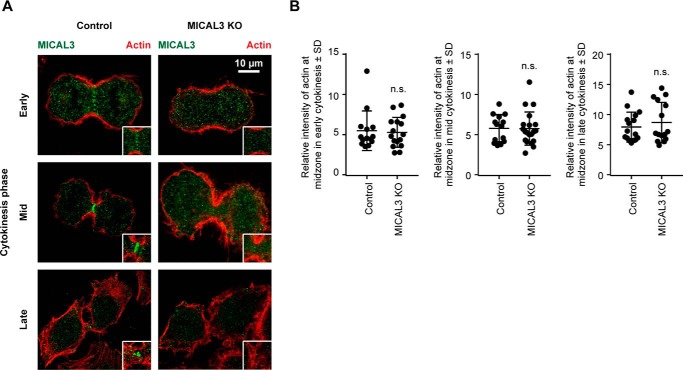
FIGURE 6.
Actin distribution in MICAL3 knock-out cells. A, immunostaining of MICAL3 (green) and actin (red) in control or MICAL3 knock-out cells. Insets, magnifications of the boxed areas. B, ratio of the intensity of actin at midzone to intensity in the cytoplasm in control or MICAL3 knock-out cells at different stages of cytokinesis. Around 100 cells were analyzed in 3 independent experiments. n.s., p > 0.05, Mann-Whitney U test.

