FIGURE 5.
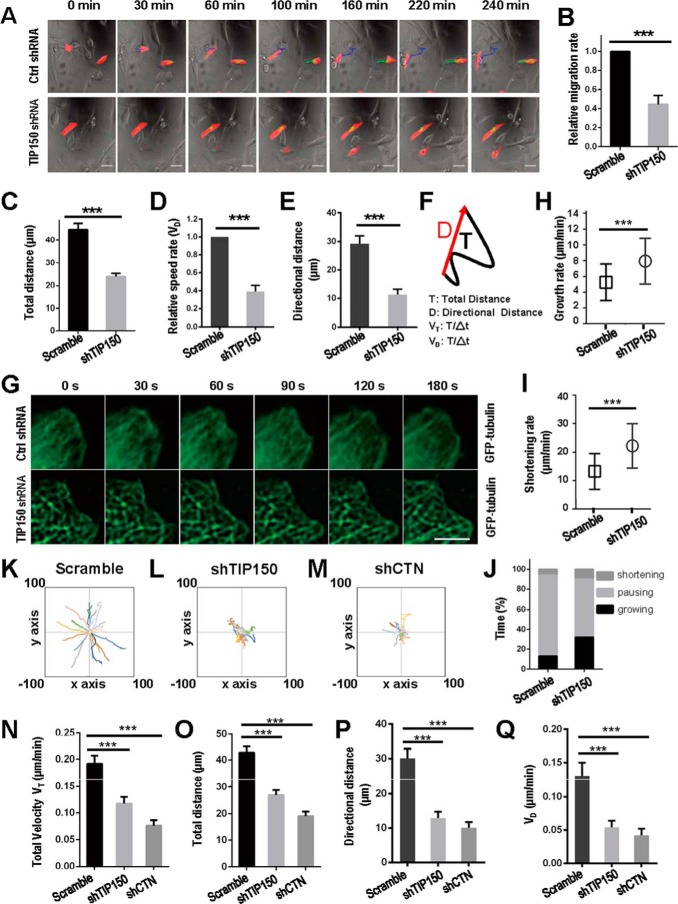
TIP150 and CTN are essential for directional cell movement. A, MDA-MB-231 cells transfected with control or TIP150 shRNA (red) were treated as described under “Materials and Methods,” and images were collected at 10-min intervals. Ctrl, control. B, migration rates of TIP150-supppressed MDA-MB-231 cells were measured, and statistical significance was determined using Student's t test. ***, p < 0.001. C, quantitative analysis measuring total migration distance of control or TIP150 shRNA-treated groups. Data represent mean ± S.E. of 65 cells collected from three independent experiments. Statistical significance was determined by Student's t test. ***, p < 0.001. D, quantitative analysis of relative cell speed. Data represent mean ± S.E. n = 65, respectively. ***, p < 0.001 by t test. E, quantitative analysis of directional distance. Data represent mean ± S.E. n = 65. ***, p < 0.001 by t test. F, visual demonstration of path length. The total distance between starting and ending points (T) and the actual trajectory (D) are indicated. G, TIP150 is required for microtubule plus end stabilization in the region of the cell cortex. Time-lapse images show the microtubule plus end dynamics in TIP150 knockdown cells. MDA-MD-231 cells were co-transfected with GFP-tubulin and control or TIP150 shRNAs for 72 h. Live-cell images were collected at 10-s intervals. Scale bar = 5 μm. H and I, statistical analysis of microtubule growth rate and shortening rate at the cell cortex in F. Data are presented as mean ± S.D. and derived from ∼100 microtubules in 25 cells. ***, p < 0.001 by t test. J, the percentages of growing, pausing, and shortening times microtubules displayed at the cell cortex in F. Data are derived from ∼100 microtubules in 25 cells. K–M, migration tracks of the indicated groups are presented from at least 20 cells. Data were collected from three independent experiments. N, quantitative analysis of total velocity in K–M. Data represent mean ± S.E. from three independent experiments. Statistical significance was determined by Student's t test. ***, p < 0.001. O, quantitative analysis of measured total distance in K–M. ***, p < 0.001 by t test. P, quantitative analysis of directional distance in K–M. Data represent mean ± S.E. from three independent experiments. Statistical significance was determined by Student's t test. ***, p < 0.001. Q, quantitative analysis of measured speed rates in K–M. ***, p < 0.001 by t test.

