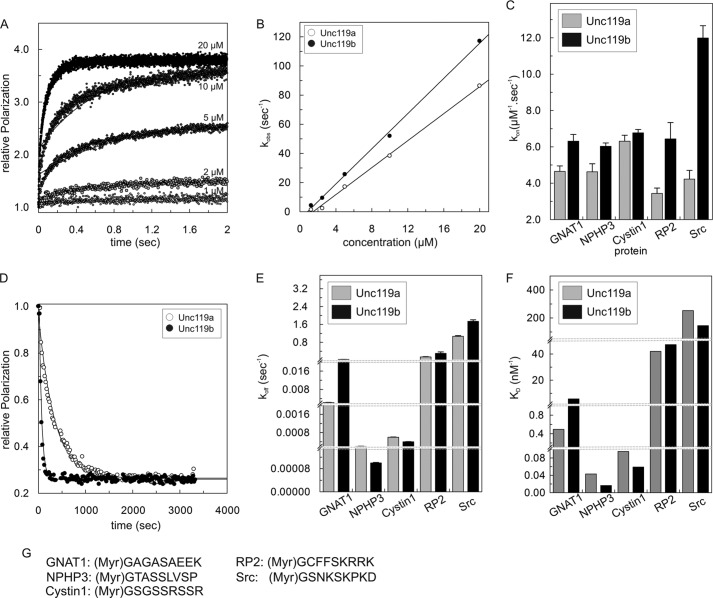
FIGURE 1.
Interaction of Unc119a/b with N-terminal myristoylated peptides. A, kinetics of association between fluorescently labeled GNAT1 peptide (1 μm) and different concentrations (1–20 μm) of Unc119a. Rates were measured as change in fluorescence polarization using a stopped flow instrument. Reactions were carried out at 25 °C in buffer A. Observed rate constants (kobs) of associations were obtained by single exponential fitting of individual curves. B, the observed association rate constants kobs for interaction of Unc119a and Unc119b with N-terminal myristoylated cargo peptide (GNAT1) obtained as in A were plotted against the concentration of Unc119a and Unc119b. The association rate (kon) is represented by the slope. The kon values for all N-terminal myristoylated cargo peptides (GNAT1, NPHP3, Cystin1, RP2, and Src) are summarized in a bar diagram (C) and in Table 1. D, dissociation of cargo was measured at 25 °C in buffer A by monitoring the decrease of fluorescence polarization after incubating a complex of fluorescein labeled peptide with Unc119 (1 μm) with a 100-fold excess (100 μm) of unlabeled peptide. Dissociation rate constants (koff) were obtained by single exponential fitting of the data. All koff values are summarized in a bar diagram (E) and in Table 1. F, equilibrium dissociation constants (KD) were calculated as ratios, koff/kon, and the values are plotted as a bar diagram and summarized in Table 1. G, the sequences of N-terminal myristoylated peptides used in this study. For labeled peptides, fluorescein fluorophore was attached at the C terminus of N-myristoylated peptides. All bar graphs show the average of 5–7 measurements for the experiments performed by stopped flow instruments and an average of three measurements for the experiments performed by the Fluoromax instrument. Error bars, S.D., for (C) n = 5–7 and for (E) n = 3.

