FIGURE 2.
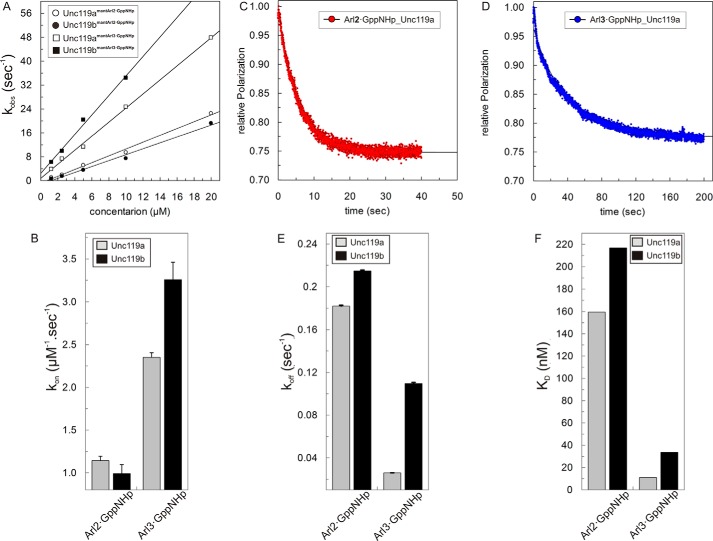
Interaction of Unc119a/b with Arl2/3. A, observed association rate constants between 0.5 μm mant-GppNHp-loaded Arl2 and Arl3 and different concentrations (1–20 μm) of Unc119a and Unc119b measured with fluorescence polarization using a stopped flow instrument as described in the legend to Fig. 1A at 25 °C in buffer A. The association rate constants (kon) of Unc119a (open circles/squares) and Unc119b (closed circles/squares) for Arl2·GppNHp (open/closed circles) and Arl3·GppNHp (open/closed squares) binding were calculated from the slope of the linear regression of the kobs values plotted against the concentration of Unc119a and Unc119b proteins. All kon values are plotted as a bar diagram (B) and appear in Table 2. C and D, the dissociations of full-length Arl2·GppNHp and Arl3·GppNHp from a complex with Unc119a/b (0.5 μm) at 25 °C in buffer A were measured as decreases of fluorescence polarization after the addition of a 100-fold excess (50 μm) of unlabeled Arl2/3·GppNHp. E, observed dissociation rate constants (koff) were obtained by single exponential fitting of the data. All koff values are plotted as a bar diagram and summarized in Table 2. F, equilibrium dissociation constants (KD) were calculated as ratios of koff/kon, and the values here are plotted as a bar diagram and appear in Table 2. All bar graphs show the average of 5–7 measurements for the experiments performed by stopped flow instruments and an average of three measurements for the experiments performed by the Fluoromax instrument. Error bars, S.D., n = 5–7.

